 Usman Salis

⬤ Gold became the center of a technical debate after a chart surfaced showing major flaws in a popular harmonic pattern that's been making the rounds. Turns out, a lot of those harmonic diagrams you see on X are using the wrong Fibonacci ratios. The whole point of sharing this was just to give traders a heads-up about the problem.
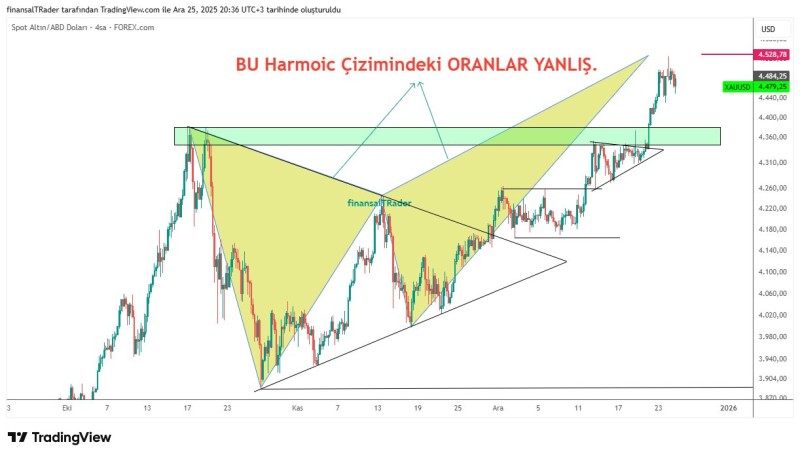
⬤ The issue boils down to poor harmonic backtesting and sloppy ratio structure when drawing these patterns. The attached four-hour XAUUSD chart shows gold climbing toward the $2,480 zone after punching through a resistance area marked in green, where someone had sketched a harmonic shape across earlier price moves. The real problem is in how those ratios were calculated inside the pattern itself.
⬤ Here's the thing: these harmonic structures might look legit on the surface, but the Fibonacci ratios underneath don't line up with proper harmonic standards. That can throw off your read on the XAU/USD chart big time, especially if you're basing trades on patterns that look good but are technically broken.
⬤ This matters because gold is one of the most-watched assets out there, and tons of traders lean on chart-based strategies. The reminder to double-check your harmonic ratios through real testing highlights why accuracy matters in XAU/USD technical analysis, particularly with price hanging near recent highs.
 Usman Salis


