 Usman Salis

⬤ Gold's been grinding higher for years now, and the long-term chart tells a pretty clear story. XAU/USD keeps following this bullish Elliott Wave pattern that's been mapped out since way back, pushing through wave after wave of upward momentum. The latest analysis shows gold still climbing through 2026, with the same directional setup that's been guiding the metal for years. Every time it's pulled back, those dips have just turned into launch pads for the next leg up.
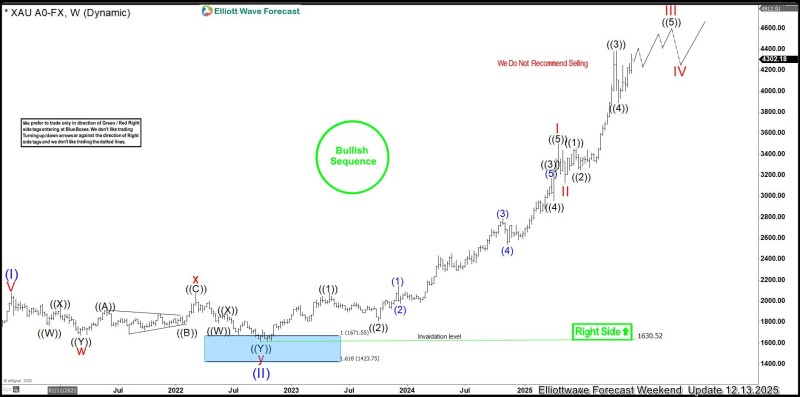
⬤ The chart shows how gold's repeatedly bounced off what analysts call "Blue Box" support zones—like that big pullback in mid-2022 that actually completed a major correction before gold took off again. Since then, it's been ripping through wave counts labeled I, II, III and IV, all pointing in the same direction. The current structure suggests gold's still in a larger third wave, meaning there's room to run higher after brief consolidation periods. "The structure has been signaling the path toward 8000 for years," according to the analysis, with those Blue Box regions marking each major turning point along the way.
⬤ What makes this outlook interesting is that gold isn't just some random asset—it's a core macro play that influences everything from currencies to safe-haven flows. When the technical picture stays this bullish for this long, it matters. The wave-based roadmap shows potential for more extensions before any serious correction kicks in, meaning temporary pullbacks would still fit within the bigger uptrend. Whether gold actually hits those longer-term targets or runs into macro headwinds, right now it's trading in one of the most extended bullish runs the market's watching.
 Usman Salis


