Saad Ullah

⬤ XAU gold has dropped below its rising wedge pattern and is now testing the old support zone from below. Price is trying to hold steady just under what's now become a resistance area, with a small bullish candle forming beneath the broken trendline.
⬤ Right now, we're seeing a textbook breakdown backtest scenario. The previous ascending support line has flipped into resistance, and gold hasn't been able to break back above it. The structure shows the market is hesitating rather than committing to a clear direction. Low volatility tells us traders are sitting on their hands, waiting for something bigger to move the needle. We saw similar quiet consolidation recently in Gold consolidation below resistance, where price got stuck between buyer support and overhead supply.
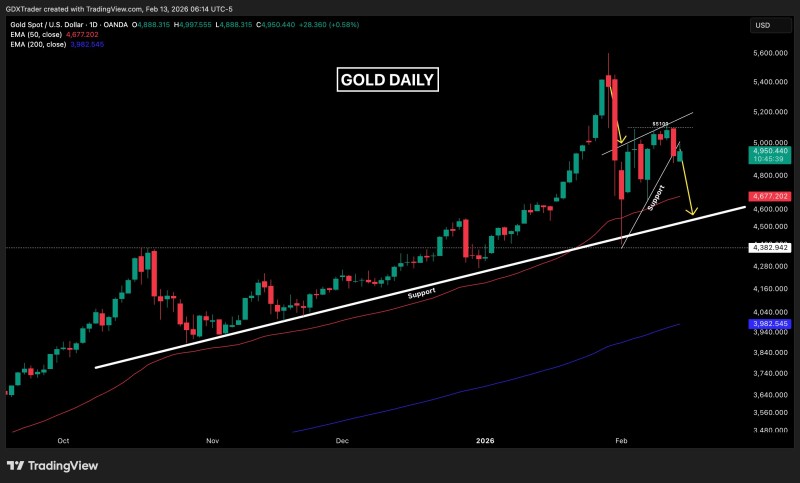
⬤ Looking at the bigger picture, the structure still looks healthy. The broader rising support and 50 EMA are holding firm, which means this breakdown hasn't killed the larger trend yet. That said, without reclaiming resistance, short-term confidence remains limited. "The market is in a wait-and-see mode until we get confirmation above or below current levels," noted one analyst tracking the setup. Similar behavior played out during Gold breaks $2,900 support after rejection, where rejection zones controlled short-term momentum before macro events drove the next leg.
⬤ With inflation data coming up, volatility could spike and override what the chart is currently showing. If gold holds its higher timeframe support, pullbacks might just be healthy corrections within a broader uptrend. But if it can't reclaim resistance, bearish momentum could take over and push prices lower in the near term.
 Saad Ullah