Alex Dudov

⬤ Gold maintains solid bullish momentum on weekly charts, with XAU trading around $4,065 following a consolidation period that comes after months of steady gains. The technical setup shows an ascending broadening wedge that's been guiding the longer-term trend since 2023, and right now the structure looks primed for what could be an even stronger move higher.
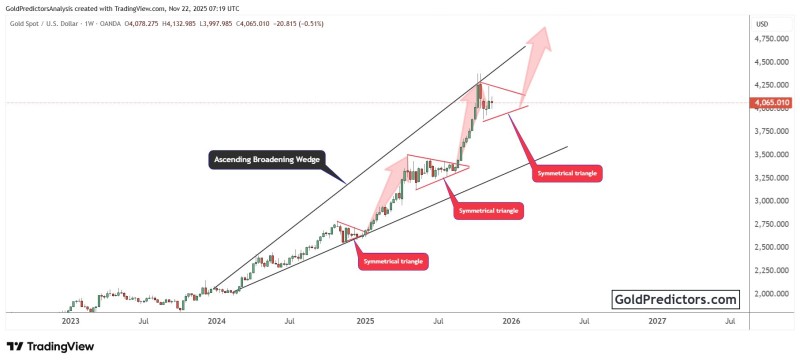
⬤ What's particularly interesting is how symmetrical triangles keep showing up throughout this rally at different stages. Each one preceded a notable breakout and expansion. The most recent triangle sits near the upper edge of that broadening wedge, with gold moving sideways after touching fresh highs above $4,100. These recurring consolidation-and-breakout cycles have been the driving force behind gold's persistent climb, and the current pattern follows that same playbook.
⬤ These symmetrical triangles demonstrate gold's consistent behavior of compressing volatility before resuming its upward path. Weekly candles are holding comfortably above the lower trendline of the wedge, confirming the uptrend stays firmly in place. The slope of this rising channel shows persistent buying pressure and solid bullish momentum that hasn't let up.
⬤ This technical picture matters because gold's long-term trend influences broader market sentiment around safe-haven assets and macro positioning. When price maintains a sequence of continuation patterns inside an expanding bullish structure like this, it reflects steady confidence even during uncertain times. With XAU consolidating within another symmetrical triangle while staying well above key support levels, the chart points to stable structural backing. How this latest consolidation resolves will likely set the tone for gold's next major directional move.
 Alex Dudov