 Marina Lyubimova

Gold (XAU/USD) is flashing a bullish reversal setup as technical indicators align for a potential breakout. A clear double-bottom formation and a decisive RSI trendline breach suggest growing momentum. Traders are now watching closely for confirmation above key resistance levels.
Gold Bounces From Key Support: Higher Highs in Sight?
Gold price action on the 4-hour chart shows a classic double-bottom pattern forming around the $1,320 level, with both lows aligning near a historically tested demand zone. Meanwhile, the Relative Strength Index (RSI) has broken above a descending trendline — a signal that bearish momentum may be weakening.
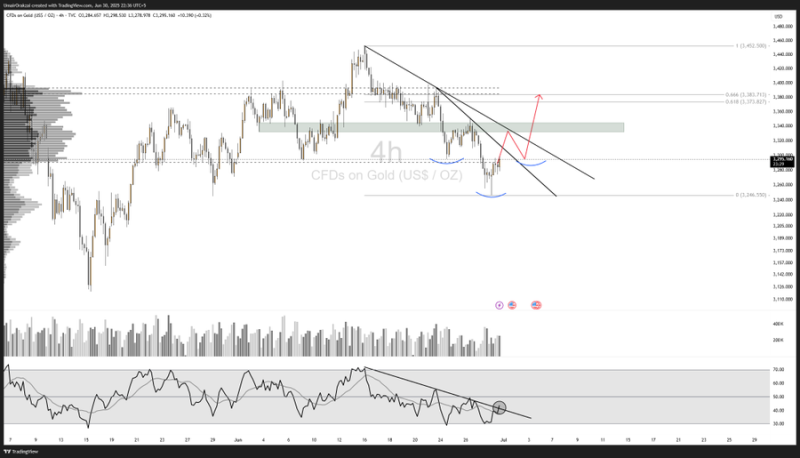
This RSI breakout is often considered an early sign of trend reversal. A sustained move above the neckline resistance could validate the double-bottom and attract more bullish positioning.
Key Resistance and Fibonacci Targets to Watch
If bulls manage to push the price above the $1,337–$1,342 resistance zone — coinciding with the neckline and a key supply cluster — the next targets lie at the 0.618 and 0.66 Fibonacci retracement levels, roughly between $1,373 and $1,381.
Beyond that, an extension toward $1,425 remains plausible, especially if volume picks up and price action continues respecting the breakout structure. However, traders should remain cautious of potential rejection at the descending trendline unless confirmed with a daily close above.
Conclusion
With short-term volatility in gold markets and a technical setup aligning for a potential reversal, all eyes are now on the RSI trendline and the $1,340 breakout zone. If confirmed, traders may begin targeting higher levels toward $1,380 and beyond.
 Marina Lyubimova


