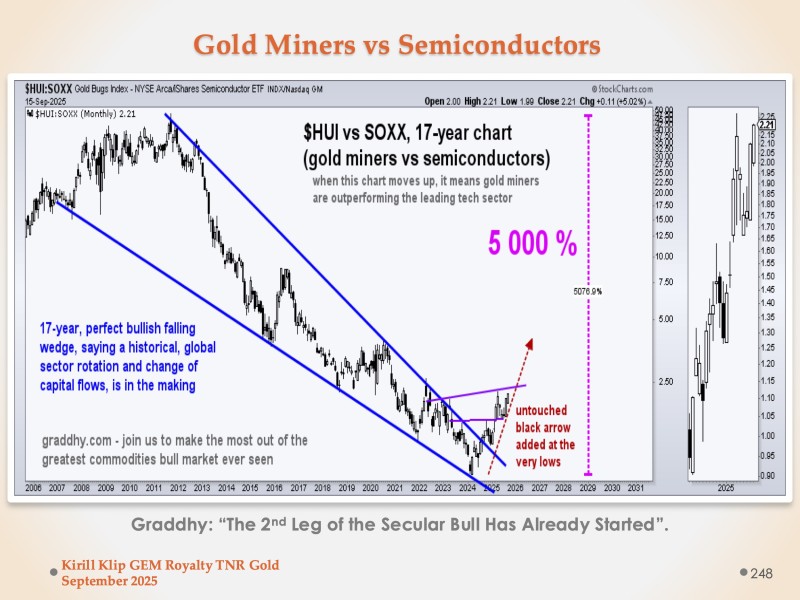
Semiconductors have ruled equity markets for nearly two decades, but that reign may be ending. A long-term ratio chart of $HUI (gold miners) versus $SOXX (semiconductors) shows what could be a major technical breakout—signaling the start of a significant capital shift from tech toward gold and mining stocks.
What the Chart Shows
Analyst Kirill Klip, sharing work from Graddhy, points to a chart suggesting gold miners could deliver 5,000% returns relative to semiconductors. If accurate, this wouldn't just be a short-term swing but the beginning of the next major leg in a secular precious metals bull market.

The ratio has been trapped in a falling wedge pattern since 2006—a setup that often precedes major reversals. After 17 years of gold miners underperforming semiconductors, the chart shows a breakout above the wedge's upper resistance line. Historical patterns suggest such long-term breakouts tend to mark generational shifts in which sectors lead markets. The projection from the 2023-2024 lows indicates a potential 5,078% gain if the rotation fully develops. A zoomed-in view confirms the breakout is gaining momentum, with higher lows and strengthening relative performance since early 2024.
This technical pattern aligns with shifting fundamentals. Higher interest rates are ending the era of cheap money that fueled the tech boom, forcing investors to reconsider real assets. Inflation remains stubborn despite aggressive Fed tightening, making gold and miners more attractive as hedges. Meanwhile, semiconductor valuations—pumped up by AI hype—may be reaching late-1990s dot-com bubble territory. Add in a potential commodity supercycle driven by demand for metals in energy transition projects, and you have conditions ripe for what Graddhy calls "the greatest commodities bull market ever seen."
The Second Leg Begins
Graddhy notes that "the second leg of the secular bull has already started." Commodity cycles typically unfold in phases: an initial accumulation period followed by explosive growth as more capital flows in. If the pattern holds, the first leg (2016-2020) was the foundation, and the second—potentially running through 2028-2030 based on chart projections—could be far more powerful.
Key signals to monitor include gold breaking above $2,500, which would confirm the long-term trend shift. Any significant correction in semiconductors, especially AI-related stocks, could accelerate the rotation. Exploration and royalty mining stocks often lead in early bull markets as investors seek leveraged exposure to rising metal prices. And continued gold accumulation by central banks—particularly BRICS nations—supports sustained demand.
After two decades of tech dominance, capital flows may finally be reversing. The 17-year $HUI vs $SOXX chart suggests gold miners are breaking out of a massive base with extraordinary upside potential. This could mark the unwinding of what some view as AI "irrational exuberance" and the start of a long-awaited commodities supercycle.
As Graddhy puts it, "The second leg of the secular bull has already started." If he's right, the next great fortunes may not be made in silicon—but in gold.
 Usman Salis

 Usman Salis


