 Peter Smith
⬤ Tesla is gaining recognition as a frontrunner in physical AI, thanks to its complete ecosystem spanning data collection, proprietary chips, advanced software, battery technology, and manufacturing capabilities. The long-term chart reveals something significant: after roughly five years of going nowhere, TSLA is finally pushing beyond its trading range, signaling what could be a genuine shift in market behavior.
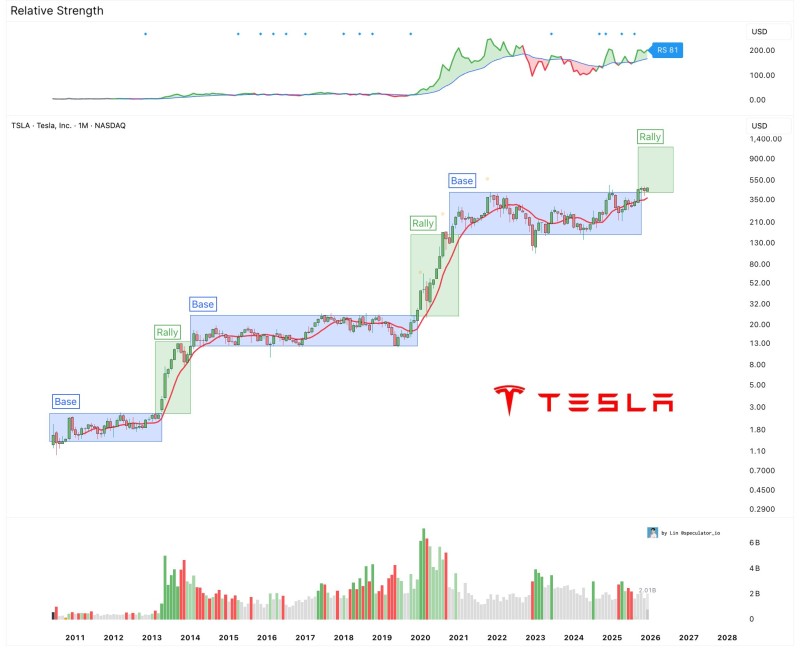
⬤ Looking at the past decade, Tesla's price history shows a clear pattern of explosive rallies followed by long periods of consolidation. The most recent consolidation stretched across multiple years, with the stock trapped in a wide horizontal channel instead of making any decisive moves. Now, price action is breaking out from this multi-year base and entering what appears to be a fresh upward phase.
⬤ The technical picture gets more compelling when you look at relative strength. The RS line has climbed to 81, showing Tesla is outperforming the broader market in a meaningful way. Price is also forming higher lows as it advances, a healthy sign that momentum is building rather than fading like it did during previous failed breakout attempts.

⬤ For traders watching the bigger picture, these multi-year base formations often mark turning points in leading growth stocks. When a stock finally escapes years of sideways movement, it tends to shift how investors think about the company's future. With Tesla positioned at the crossroads of AI, automation, and next-generation manufacturing, this transition from stagnation to growth could reshape expectations around its role in the physical AI revolution.
 Peter Smith


