Usman Salis

⬤ Tesla shares have rallied over 100% since March 24, jumping from roughly $240 to close to $500. The same chart pattern that's been tracked for two years showed the broader structure pointed toward continued gains rather than a breakdown, even when short-term price action looked shaky.
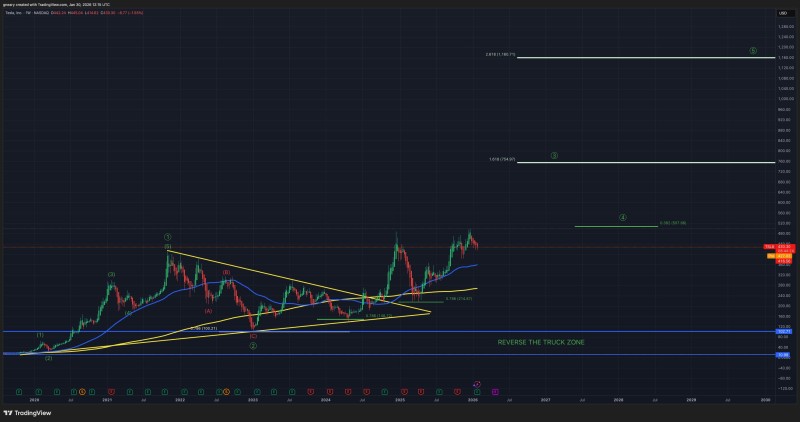
⬤ The chart reveals an extended consolidation followed by a strong upward move. Tesla spent months trading in a tightening range before breaking out and reclaiming major long-term support levels. While there were several pullbacks during the advance, the pattern stayed healthy with consistently higher lows forming throughout.
⬤ Right now, Tesla is consolidating below recent peaks, trading in the low $400s. The chart shows multiple higher projection targets above current levels, while historical support sits far below, confirming the uptrend that started with the earlier breakout remains firmly in place.
⬤ This matters because Tesla is one of the most watched stocks globally. When TSLA maintains a strong long-term trend, it often shapes sentiment across growth and tech sectors. The stock's ability to hold its structural pattern through volatility shows how long-term chart dynamics can override short-term noise and drive sustained price movement.
 Usman Salis