 Marina Lyubimova

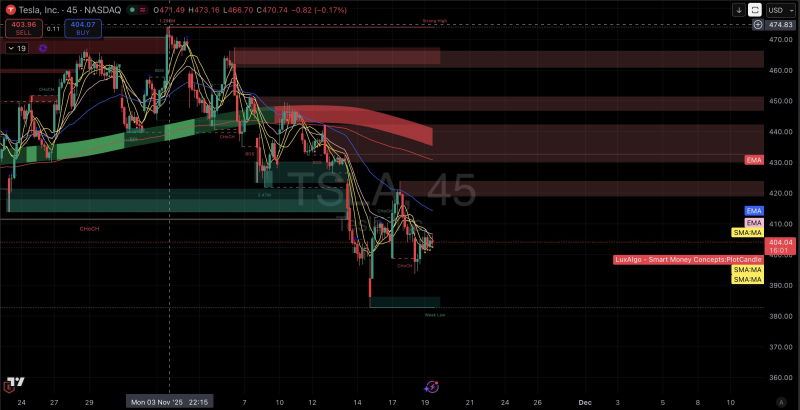
⬤ Tesla stock (TSLA) kept falling as technical indicators showed strong selling across multiple timeframes. Recent price action displays heavy red blocks representing aggressive selling, while buy blocks are almost completely absent. TSLA sits below major moving averages, with the broader structure showing bearish momentum continuation.
⬤ The 45-minute chart reveals repeated break-of-structure signals matching the ongoing downtrend. Price formed lower highs while hitting consistent rejection in supply zones between $430 and $450. Multiple EMAs and the SMA cluster above current price levels, reinforcing the downward slope. TSLA tapped liquidity near the $400 support level, briefly forming a weak low before attempting minor stabilization. Smart-money indicators show red sell blocks dominating recent sessions, highlighting the absence of institutional buying.
⬤ Market sentiment around Tesla has deteriorated sharply, with broad bearish positioning evident since recent events. The chart confirms sustained selling pressure, as sell-side blocks and downside trend signals remain visible throughout the structure. The absence of buy blocks matches the stock's failure to reclaim key resistance zones or break above declining moving averages.
⬤ Persistent sell-side dominance and repeated failures to reclaim overhead supply zones signal continued market caution. TSLA needs to recover above major moving averages and push through clustered resistance before any meaningful momentum shift occurs. Until those structural changes appear, technical readings support a cautious outlook as the stock consolidates near lower support areas.
 Marina Lyubimova


