Usman Salis

⬤ Tesla shares have slipped into correction mode after breaking below a key rising diagonal on the daily chart. According to the analysis, the bigger picture still looks bullish long term, but the near term setup is pointing toward lower prices. TSLA is currently trading around $421 after failing to hold the upper part of its rising channel, which signals a shift in short term momentum.
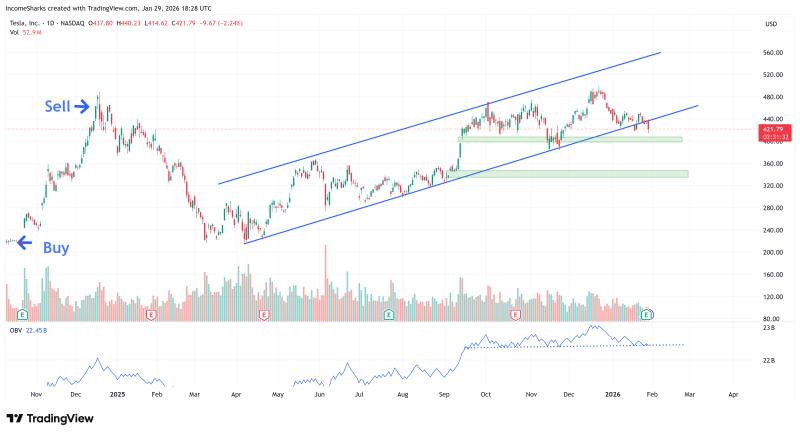
⬤ For most of 2025, Tesla's price action stayed within an ascending channel marked by consistent higher lows and steady upward movement. That pattern has now weakened, with the diagonal trendline clearly broken. The focus has shifted to a lower gap shown on the chart, which represents the ideal downside target during this pullback. These gaps typically act as natural price magnets when stocks correct after strong rallies.
⬤ Volume trends back up the cautious outlook. On balance volume, displayed in the lower panel, shows potential distribution instead of strong buying interest. While there hasn't been a sharp collapse, OBV no longer supports the previous upside momentum. Still, TSLA remains well above its earlier 2024 lows, keeping the longer term trend intact despite near term pressure.
⬤ This matters because Tesla is a major leader in the growth and tech space. A measured pullback into lower support could help reset positioning after a powerful rally, but failing to stabilize near that gap would increase downside risk. Right now, TSLA is caught between long term optimism and short term technical caution as traders watch whether support levels can handle the selling and bring back some directional clarity.
 Usman Salis