Saad Ullah

⬤ Tesla stock is catching attention again as the monthly logarithmic chart shows price action pushing toward the upper end of a multi-year structure. After moving through several major expansion and consolidation phases over the past decade, TSLA is now sitting close to a historically significant resistance zone. This setup has traders watching closely to see if the stock can break through or faces another pullback.
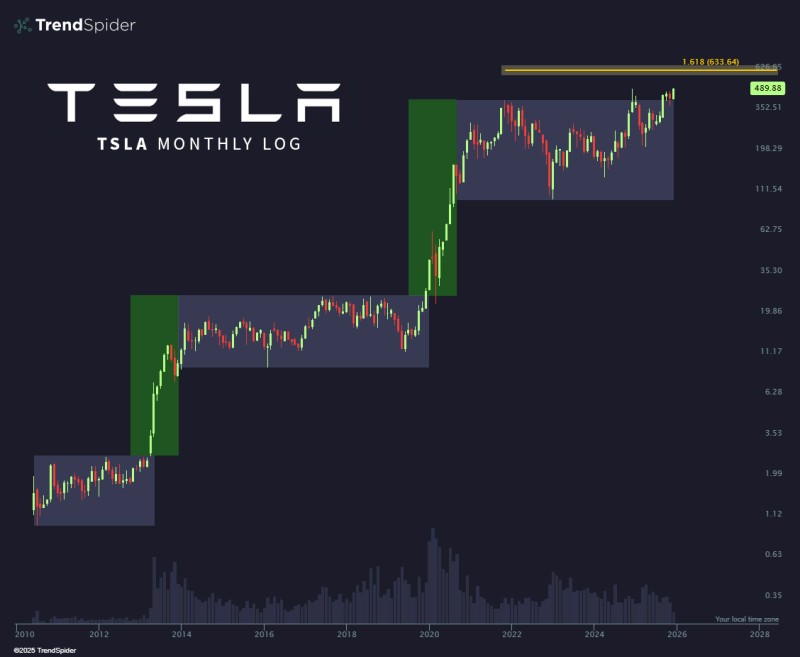
⬤ The chart reveals how Tesla transitioned from a long consolidation period into a fresh advance, following the explosive vertical move during 2019-2020. After that surge, the stock settled into a broad trading range where it fluctuated for years. Recent monthly candles show a push back toward the top of this range, with current price near $489.88, bringing Tesla close to previous highs within this established structure.
⬤ The key technical level around $633 shows up as a Fibonacci extension on the chart, marking a long-term reference point rather than an immediate price target. The monthly pattern shows how past consolidation periods led to sharp directional moves once higher levels held. Volume patterns at the chart's bottom match up with earlier expansion phases, highlighting why this current zone matters so much.
⬤ For the broader market, Tesla's positioning carries weight because it's one of the most-watched stocks across growth, tech, and EV sectors. When a major name like TSLA tests the upper boundary of a multi-year range, it shapes expectations around trend strength, volatility, and where institutional money flows next. That's why so many traders and investors are keeping a close eye on how Tesla behaves at these levels.
 Saad Ullah