Peter Smith

NVIDIA stock is consolidating within a clearly defined range, with price holding near support while repeatedly failing to break above resistance. Analyst Gabz, in a NVDA tests key $180 resistance ahead of breakout attempts, identifies $180 as the critical ceiling with an extended resistance zone stretching to $184-$185. The current setup reflects a market waiting for confirmation, as both structure and momentum signals remain unresolved.
NVDA Resistance Caps Price Near $180-$185
The chart confirms this area as a firm ceiling, with multiple rejections preventing price from moving higher. At the same time, price is hovering near $177, acting as a short-term pivot that defines whether the structure holds or weakens.
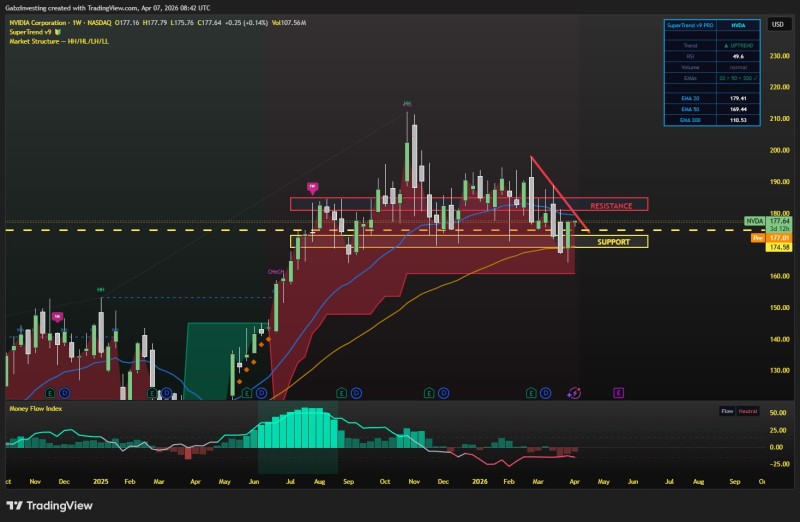
Multiple rejections at the $180 level confirm this as the decisive ceiling - a breakout above opens meaningful upside potential
This aligns with broader NVDA technical patterns where resistance around $180 remains a decisive level for continuation or rejection.
NVDA Support Zone Aligns With 200 EMA Near $173
Below current levels, a stronger support zone is defined between $169 and $173, closely aligning with the 200 EMA near $173.77 shown on the chart.
This type of confluence is often critical in NVDA consolidates near $170 as $180 breakout level dominates structure. Similar setups have shown that holding key moving averages can stabilize price before the next directional move, particularly when consolidation forms above major support.
Holding the 200 EMA zone is what separates a healthy consolidation from a deeper breakdown - buyers need to defend this area
The structure now depends on whether buyers can defend this zone and prevent a deeper breakdown.
Mixed Signals Across Timeframes
The chart highlights a divergence between timeframes. The daily SuperTrend remains in a downtrend, while the weekly structure stays bullish with a strong EMA stack.
This kind of split typically results in consolidation phases. NVDA has repeatedly shown this behavior - holding structure while momentum resets - before resolving into a larger move. The result is a compressed range where neither buyers nor sellers have full control.
When daily and weekly signals diverge like this, consolidation is the natural outcome - the market is simply waiting for a catalyst
The Trigger That Could Shift NVDA Momentum
Momentum indicators remain neutral, with the Money Flow Index flattening near zero. A move back into positive territory would signal renewed strength.
The key trigger remains a breakout above the descending trendline. If price can reclaim that structure and hold, the path opens toward the $180-$185 resistance zone once again. Historically, reclaiming this region has been associated with renewed upside momentum and continuation patterns, as seen in NVDA holds below resistance as consolidation phase develops.
Until that breakout occurs, price remains locked in consolidation between clearly defined levels, with patience dominating the current stock market trend.
 Peter Smith