 Eseandre Mordi
⬤ Nvidia stock is hanging around a pretty important technical spot right now, trading near $183 and sitting just underneath a resistance trendline that's been keeping a lid on rallies since early November. The price action shows the stock holding up pretty well after several weeks of pulling back, and if buyers keep showing up, we could see a test of that $186–$187 zone coming up.
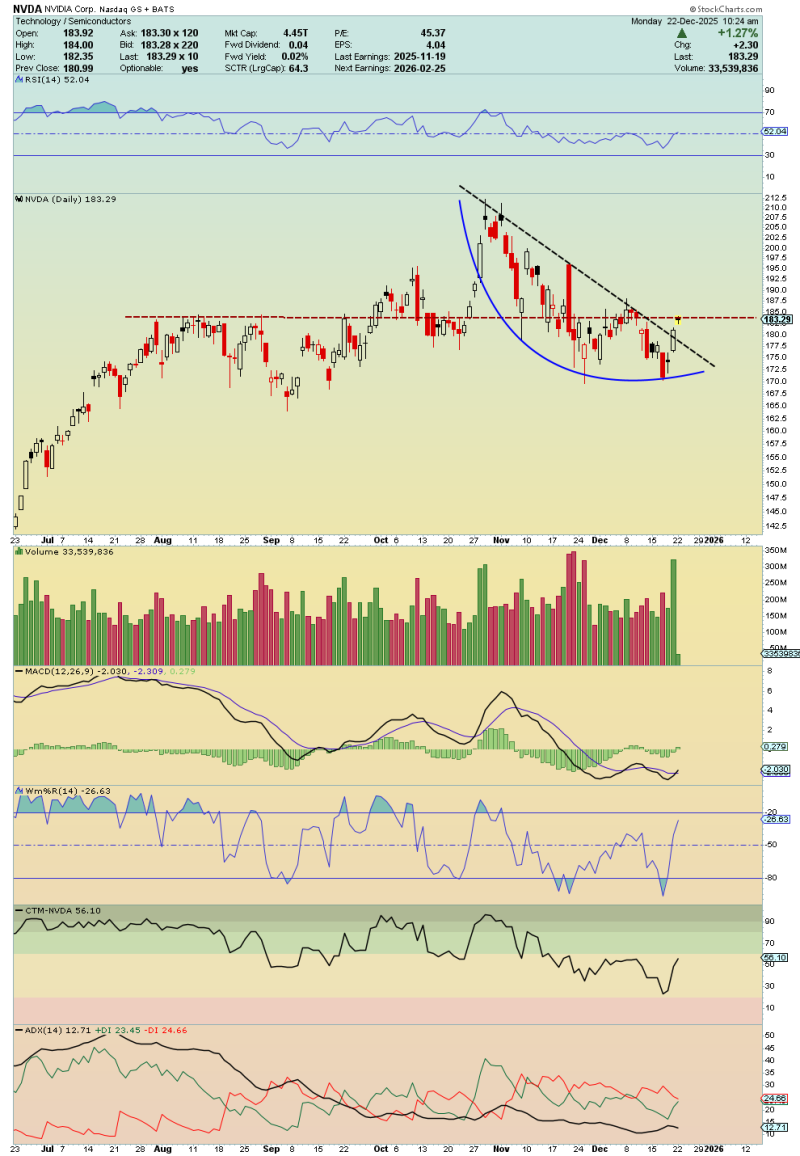
⬤ The chart reveals a downward-sloping trendline cutting through the mid-$180s, with price forming a rounded base pattern underneath. This setup suggests the stock is stabilizing rather than breaking down. NVDA is still holding above recent lows around $170–$172, which means the broader structure of higher lows remains intact even during this correction. Volume looks fairly balanced, indicating steady interest without any major selling waves.
⬤ The momentum picture backs up this consolidation phase. RSI is sitting in neutral territory—not overbought, not oversold—which matches the sideways movement we're seeing. The MACD histogram is flattening out after a bearish stretch, showing that downward momentum is losing steam. Other indicators like Williams %R and ADX point to weakening trend strength, suggesting Nvidia is taking a breather rather than gearing up for a sharp move.
⬤ This setup matters because Nvidia sets the tone for semiconductors and AI stocks. A clean break above resistance would boost sentiment across growth names, while continued rejection could keep this consolidation going into early 2026. With NVDA sitting at this decision point, its next move will likely shape how the broader tech sector trades, especially for stocks that have been moving in sync with Nvidia throughout the year.
 Eseandre Mordi


