 Saad Ullah
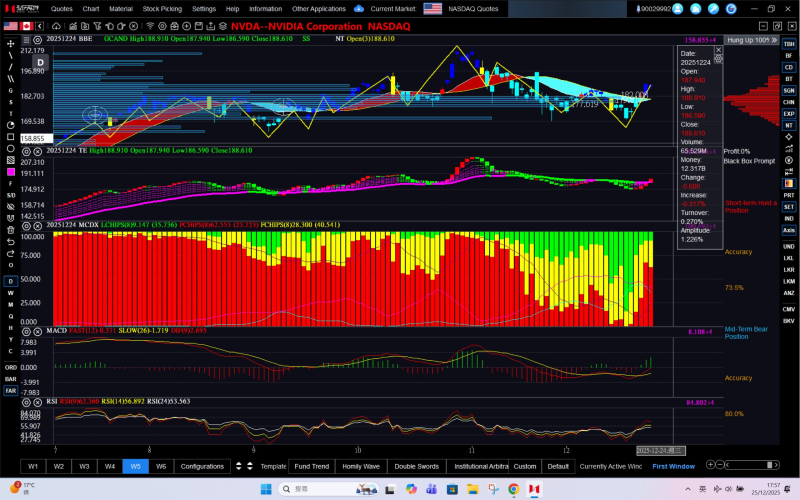
⬤ Nvidia Corporation (NASDAQ: NVDA) continues drawing intense trader attention as sentiment debates swirl around the stock. Recent bearish commentary on NVDA is being dismissed as market noise that might actually point to contrarian opportunities. The daily chart shows NVDA trading around 188.61 dollars, with technical indicators tracking momentum, trend, and volume. The focus is on how sentiment-driven narratives often clash with actual price movement in NVDA.
⬤ The analysis claims that 99.999 percent of bearish tweets about NVDA are just noise and have historically aligned with contrarian buying windows. Elliott Wave analysts who wanted to buy Nvidia at 62 dollars during April's downturn and again at 120 dollars recently are cited as examples. These pessimistic calls didn't match the price trend that followed, suggesting that heavy negativity often shows up near market bottoms rather than tops.
⬤ The commentary mentions buy signals shared with subscribers that reportedly beat traditional analytical methods. Still, there's an important catch: these indicators tend to work best on large cap tech stocks like NVDA, though results vary depending on market conditions. The bigger takeaway is how sentiment, technical tools, and trading strategies collide around high-profile tech names like Nvidia. Debates over signal reliability can sway short-term psychology, risk positioning, and momentum equity participation. As NVDA pulls interest from both institutional and retail crowds, shifting views on sentiment indicators may influence trading patterns and volatility across the broader tech sector.
 Saad Ullah


