 Alex Dudov
⬤ Netflix is going through a pretty rough patch right now, with shares falling to around $82 in pre-market trading. That's a significant drop from the highs above $110 we saw not too long ago. But here's the thing – the bigger monthly trend is still pointing up, so this could just be a correction rather than a full reversal.
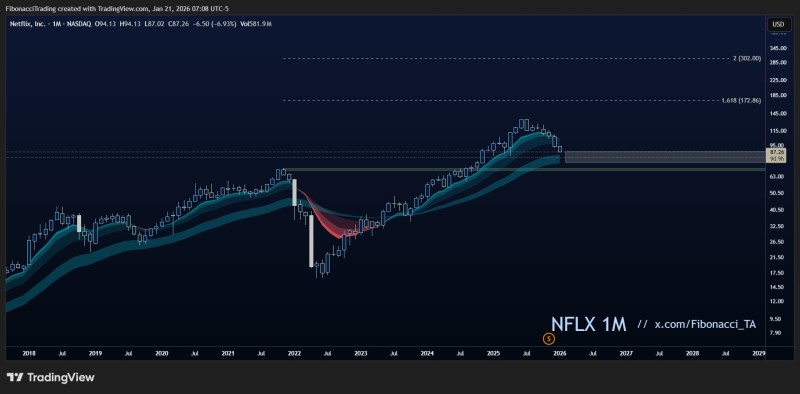
⬤ Looking at the monthly chart, NFLX has pulled back into the $82–$87 range, which actually lines up with an old support zone. The moving averages are still climbing, which tells us the long-term trend hasn't broken yet. The really important level to watch is around $68 – if the stock closes below that on a monthly basis, then we'd have to seriously reconsider whether this uptrend is still alive.
⬤ The momentum indicators are painting a pretty dramatic picture. The monthly RSI is sitting at just 21, which puts Netflix deep in oversold territory. That's not necessarily a bad thing – it often means the selling has gotten overdone and a bounce could be coming. There are also some longer-term price targets mapped out on the chart, including one around $173 and another way up at $300, though those are obviously dependent on the stock regaining its footing first.
⬤ Netflix isn't just any stock – it's one of those big tech names that everyone watches. When NFLX stumbles, it can shake confidence across the whole growth stock sector. The key question now is whether it can hold above that long-term support and start working its way back up. If it does, this pullback might end up looking like a buying opportunity. If it doesn't, well, that's when things could get interesting.
 Alex Dudov


