 Marina Lyubimova
⬤ Netflix (NFLX) slid again this week and now hovers near $95.95, down 4.28 percent in one session. The stock sits just above an $85 target after it dropped cleanly under its 200-day moving average. The breach of that long term line has sped the decline and brings price close to a level that reversed the trend in the past. The quote now nears the lower border of a rising channel that has held since early 2023.
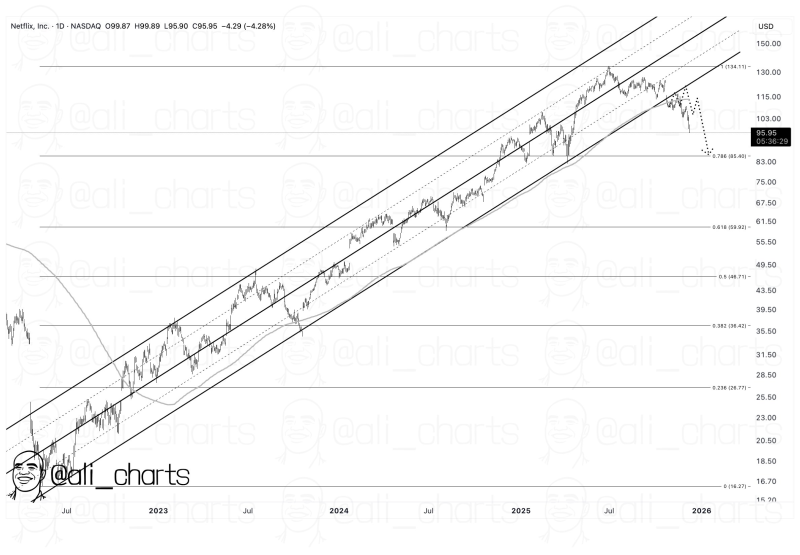
⬤ The picture shows the share dropping out of that multi year upward track plus slicing through multiple internal support lines. A dotted guide on the chart aims toward the mid-80s, near the 0.786 Fibonacci retracement at $85.40. The channel itself, touched many times through 2023 and 2024, no longer holds as buyers retreat. The fall from above $130 to the mid-90s underlines the shift in tone once the 200-day average gave way.
The loss of that long term trend level has accelerated downside momentum.
⬤ Lower Fibonacci marks sit at $59.92 (0.618) and $46.71 (0.5) - yet the first area to watch remains the $85 zone. The sketched path implies further drift downward until price finds a firmer floor. The many touches of the old rising channel show how notable the break has become - earlier support levels no longer buffer the decline.
⬤ Such events carry weight because a break of the 200-day average often tips short term mood but also forces a reset of expectations. When a stock exits a multi year channel, the long term trend may change and traders re evaluate support. Netflix's approach to $85 raises the question of whether price will settle there or continue toward the deeper retracements that marked prior corrections.
 Marina Lyubimova


