Saad Ullah
⬤ Netflix has hit the brakes after an impressive multi-year rally, and the weekly chart is starting to tell a different story. The stock is now consolidating, with price action drifting down toward the $200 to $175 zone—an area traders are eyeing as a potential make-or-break level. After months of climbing higher, NFLX is finally taking a breather, and the momentum that carried it through 2023 and 2024 has clearly cooled.
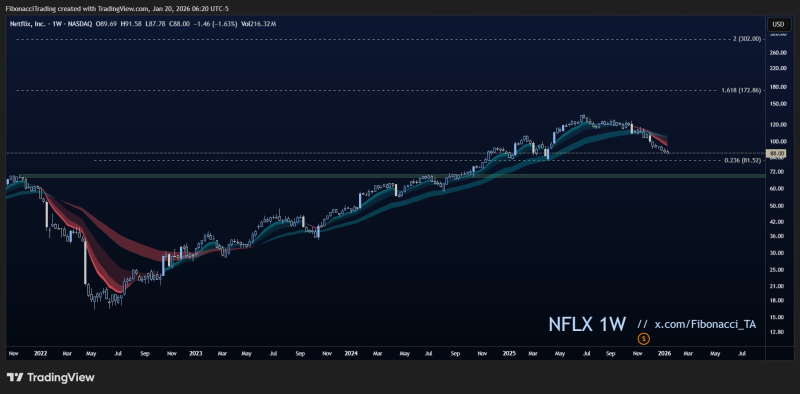
⬤ The weekly chart paints a clear picture: Netflix kicked off a solid recovery back in 2022 and kept pushing higher through the following years, staying comfortably above its rising moving averages. But now, those weekly candles are turning red and sliding closer to support levels that mattered during the climb. The stock isn't crashing—it's just losing steam and settling into a tighter range after such a powerful move.
Netflix stands out as a top candidate to monitor, with attention centered on the $200 to $175 range highlighted as a key area of interest.
⬤ Looking at the Fibonacci levels on the chart, price is now approaching zones that acted as stepping stones during the broader uptrend. The market seems to be reassessing where Netflix should trade after such a strong run, and there's no clear signal yet whether buyers will step back in or if sellers will push it lower. What's interesting is that there's no panic selling—just a gradual pullback that suggests the market is taking a pause rather than reversing course entirely.
⬤ Netflix remains one of the most-watched names in big-cap tech and media, so how it handles this consolidation matters beyond just the stock itself. If it can hold these weekly support zones, the longer-term uptrend stays intact and could attract fresh buying. But if it slips further, the pullback might have more room to run. Right now, the chart shows a stock in transition—testing key levels and trying to figure out what comes next after delivering such strong gains.
 Saad Ullah