 Victoria Bazir

⬤ Microsoft's chart has delivered a solid bounce after reaching the marked support region between $235 and $185, keeping the bullish trend intact. The price turned up cleanly from this high-probability reversal zone, with the Elliott Wave structure pointing toward continuation of the dominant upward sequence. MSFT remains positioned on the right side of the trend, and the broader bullish outlook stays valid as long as the stock holds above the invalidation level at $213.43.
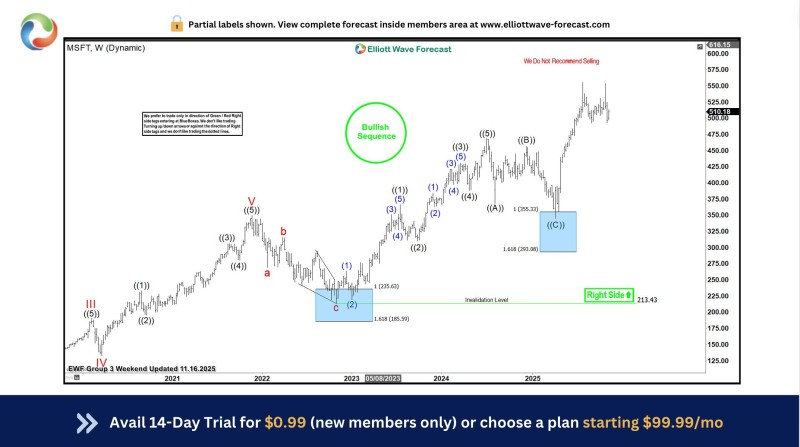
⬤ The chart shows MSFT previously completed a correction into the blue-box area, where buyers stepped in and pushed prices higher. That same pattern has now repeated, with another completed corrective structure triggering a fresh rally toward the $500 zone. The price action validates the projection that favored continuation rather than extended downside. This behavior matches MSFT's historical tendency to respect Fibonacci-based support zones, reinforcing confidence in the current structure.
⬤ The wave structure indicates clear higher-degree bullish cycles, with completed corrective legs followed by renewed upward movement. Previous downside targets at $355.33 and $293.08 never materialized before the current advance began. The consistency of strong reactions from major support zones strengthens the view that MSFT is maintaining its multi-year bullish trend, with the recent bounce serving as important confirmation.
⬤ The continued strength supports a broader positive tone in large-cap tech, with MSFT playing a key role in market sentiment. The reaction from the support region helps maintain confidence in trend-based analysis and supports a constructive outlook across the technology sector as the stock's upward structure remains dominant. Ai news also highlighted that Microsoft secured U.S. approval to ship Nvidia AI chips to the UAE and announced a $7.9B infrastructure expansion plan, adding another layer of momentum to investor sentiment.
 Victoria Bazir


