 Marina Lyubimova

⬤ MicroStrategy (MSTR) now tests a major support level after months of selling pressure. The stock stays near $186 and rests on a key technical zone that started to form early in the year. After it completed what looks like a classic A-B-C correction pattern, the shares pulled back to a support band between $141 and $132. This band will decide the next direction.
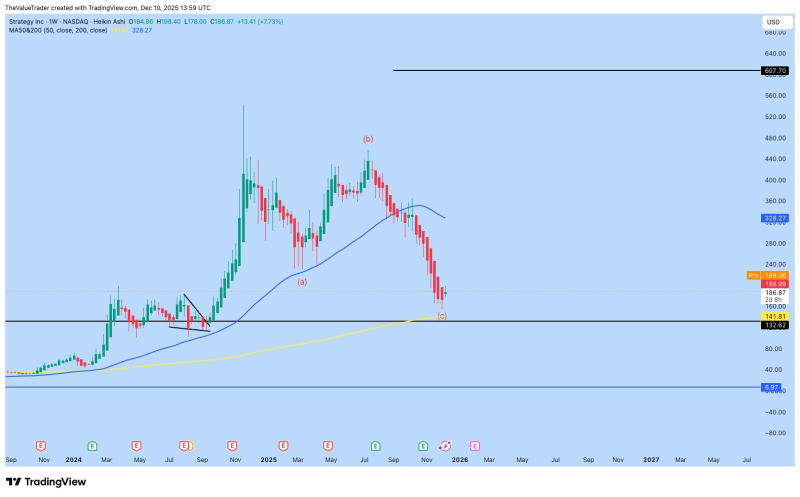
⬤ The weekly chart shows the picture. MSTR trades far under its 50-week moving average at $328, which shows how steady the 2025 downtrend has been. What counts now is that the stock bounces around its 200-week moving average, a level that has often marked a turn for volatile names. The fall from almost $600 has removed most of the rally's strength and that sets up the chance that the selling will finally run out of energy.
⬤ Recent weekly candles show the drop is losing speed. MSTR has not turned bullish, but the way it reacts to this long term support hints that the worst part of the correction may have passed. If the stock stays above $141-$132, the larger uptrend remains valid. If it falls under that band, a breakdown will shift the focus to much lower support levels from past years.
⬤ This is important because MicroStrategy has become the stock traders use to bet on crypto adjacent firms. A bounce here could raise confidence in similar high growth names. A breakdown would bring more caution to the riskier corners of the market. Whatever happens at this support zone will set the tone for the next multiple weeks.
 Marina Lyubimova


