 Artem Voloskovets

⬤ Meta Platforms shares have begun climbing after touching the corrective support zone identified in the Elliott Wave analysis. META responded exactly as anticipated from this area, and long positions are now sitting comfortably in profit following the initial rebound. The stock is currently trading around $705, steadily recovering after wrapping up a structured decline earlier this year.
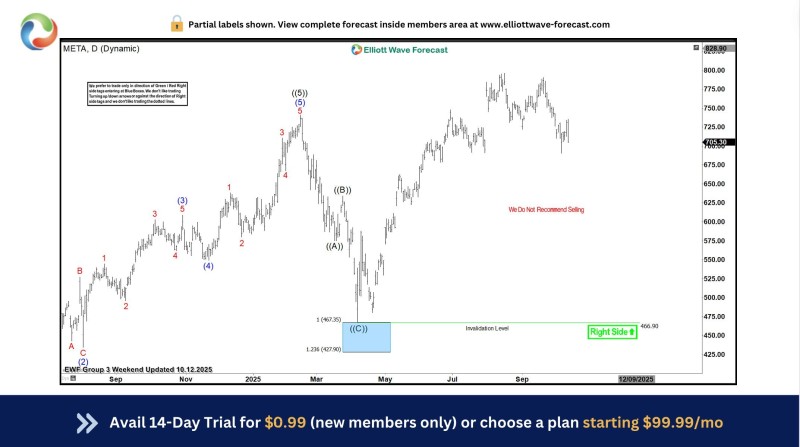
⬤ The technical chart reveals a completed corrective pattern that landed right within the 1.0 to 1.236 Fibonacci extension area, roughly between $467 and $428. This zone typically signals the end of deeper pullbacks in Elliott Wave cycles. META held firm above the critical $466.90 level and bounced back strongly, confirming that the bigger uptrend is still alive and well. The pattern shows a finished ((A))–((B))–((C)) sequence, fitting neatly into the broader bullish framework.
⬤ With the bounce now confirmed, META has shifted back into gear and is forming a fresh upward wave. Recent trading sessions show consistent buying pressure, with the stock pushing toward the $725–$750 range after defending support levels. The analysis clearly states that selling isn't advised right now, highlighting the bullish outlook. This setup points to further gains potentially reaching previous peak levels.
⬤ This development matters because META is once again attracting strong buying interest after wrapping up its correction within a longer-term uptrend. The rebound from the support area shows that investor confidence in the stock remains solid. If this momentum keeps building, the emerging upward pattern could take META back to—or even beyond—its earlier highs, adding fresh strength to the broader tech sector.
 Artem Voloskovets


