 Peter Smith

Meta Platforms continues to flex its muscle in the short term, with bulls now laser-focused on the captures the buzz among traders watching Meta climb higher. The latest 1-hour chart shows the stock could actually hit this target if key support levels stay firm and buying momentum keeps up.
Technical Picture: Building a Bullish Staircase
Posted by John The Rock Trading Co. , the 1-hour TrendSpider chart shows Meta forming a textbook bullish staircase, with each pullback establishing a higher low—a reliable sign that the uptrend is alive and well. After finding its footing around $739–$746, the stock pushed through $755, confirming fresh buying interest. The chart reveals solid demand zones (marked in green) between $732 and $746, where institutional money appears to be stepping in. The most recent dip was quickly bought up near $746.66, showing that buyers are defending the floor just below current prices.
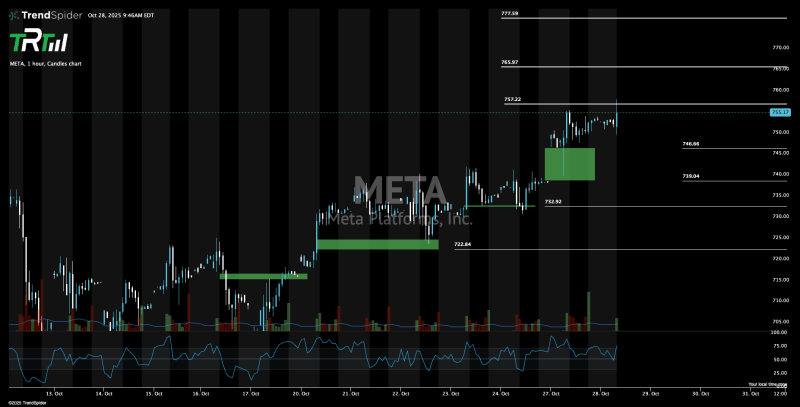
Key Levels to Watch:
- Immediate resistance: $757.22
- Next targets: $765.97 and $777.59
- Support zones: $746.66 and $732.92
- Major demand base: $722.84
- RSI: Bouncing from mid-range, showing strength without being overheated
- Volume profile: Green spikes on upward moves confirm real buying, not just short covering
- Pattern: Higher lows, tight consolidation, and limited selling pressure point to another rally attempt
A clean break above $757 could spark a quick run toward $765–$777, especially if volume kicks in. But if the stock slips below $746, expect a retest of the $732 zone, where dip buyers are likely waiting.
Why the Bulls Are Confident
Meta's technical setup isn't happening in a vacuum. A few things are working in its favor:
Big-cap tech stocks are leading the broader market rally. Meta's heavy investments in AI and ad platform improvements continue to drive revenue growth. Price action suggests institutional accumulation rather than retail speculation—always a good sign for sustained moves.
These fundamentals add credibility to the technical picture, making $777 look less like wishful thinking and more like a realistic next stop if momentum holds.
Meta's intraday chart tells a clear story: controlled bullish pressure backed by rising volume and multiple layers of support. As long as the $746–$750 zone holds, the path of least resistance is up, with $777 sitting right in the crosshairs. Traders are watching closely to see if this rally has another leg—or if it's time for a breather.
 Peter Smith


