Usman Salis

IREN Limited is drawing attention from chart watchers as the stock settles into a well-defined wedge pattern on the weekly timeframe. After a strong rally that pushed prices toward the $60-$70 range, IREN has pulled back and entered a consolidation phase near the $43 level. The pattern, characterized by descending resistance and rising support, suggests accumulation rather than distribution - and has analyst Sky eyeing a potential breakout toward $80 or higher.
Wedge Compression at $43 Points to Potential $80 Breakout
The technical structure is clear: IREN is printing higher lows while facing lower highs, a classic sign of price compression rather than trend reversal.
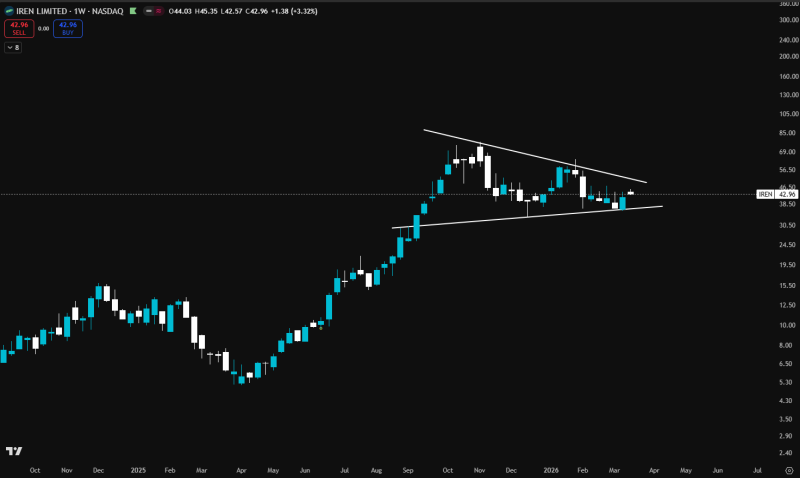
This tightening range reflects a standoff between buyers and sellers, with both sides gradually giving ground. As noted in IREN Stock Tests $45 Resistance: Will Price Break Higher or Consolidate Further?, the stock has been narrowing below key resistance levels in the mid-$40s for some time now.
$43 Support Zone Holds as Longer-Term Targets Stay in Focus
Recent price behavior confirms the stock is holding above key support in the low-$40 region. That alignment was also highlighted in IREN Stock Analysis: $43 Support Holds as $100+ Target Remains in Play, which noted that IREN maintained its structure through consolidation while keeping extended upside targets on the table. Broader catalysts have reinforced the setup - per IREN Stock Rises as MSCI Index Inclusion Drives Buying, index-driven forced buying has added a fundamental layer beneath the technical compression near $40.
Declining volatility inside the wedge is typically a precursor to a larger directional move. As long as the pattern boundaries hold, the $80+ projection remains the primary upside scenario. For short-term traders and longer-term investors alike, the next break - up or down - will set the tone for IREN's next significant leg.
 Usman Salis