 Peter Smith

Intel is approaching a decisive moment after breaking above a long-standing resistance level that dates back to 2022. As Ryan Mallory pointed out, the chart shows a bull flag-like structure followed by a breakout - but the key question now is whether INTC stock can hold those gains or slip into a failed move.
The INTC Level That Defined Years of Rejection
The chart clearly shows a horizontal resistance line near the $52 zone, stretching back multiple years. Price has now pushed above that level, marking a notable structural shift.
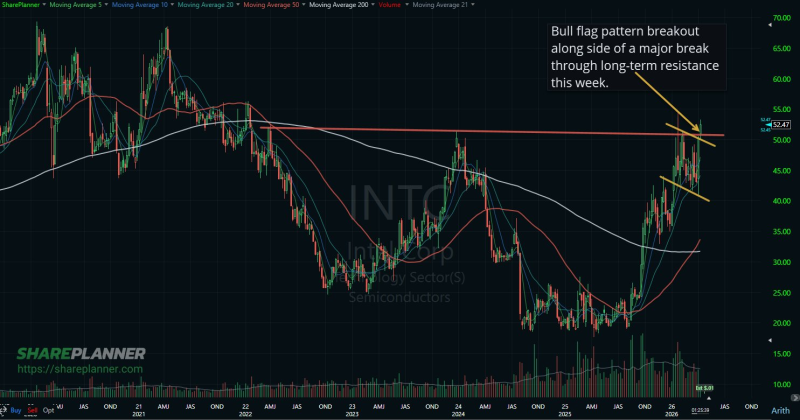
This breakout follows a prolonged downtrend that transitioned into recovery, with price climbing from the low-$20 region into the $40s and beyond. The move into resistance was built on a sequence of higher lows - signaling strengthening demand over time. A break of such a long-term ceiling typically carries weight, but only if the market can sustain price above it.
A break of a multi-year resistance ceiling typically carries weight - but only if the market can sustain price above it, and that confirmation has not yet arrived.
INTC Stock Stalls at $40.05 Resistance as INTC Tests Breakout Level captured an earlier stage of this breakout attempt, showing how INTC had been building toward this moment across multiple resistance tests before the current move.
The Bull Flag Structure Behind the INTC Move
Leading into the breakout, the chart highlights a tight consolidation channel - a downward-sloping formation consistent with a bull flag pattern. That structure reflects controlled profit-taking rather than aggressive selling:
- Price pulled back in a contained range after a sharp rally
- Lower highs formed within the channel without structural breakdown
- Buyers re-entered before deeper retracement could develop
The eventual breakout above both the flag and the long-term resistance adds confluence to the move, reinforcing the bullish technical setup. INTC Price Prediction: Pre-Earnings Analysis and What's Next for $INTC outlined the fundamental backdrop heading into the move, providing context for why demand has been building underneath INTC's recovery structure.
A INTC Rally That May Be Running Hot
While the breakout is technically significant, the chart also supports caution. Price has extended sharply above its moving averages, with shorter-term averages stacked bullishly and the 200-day moving average trending well below current price. This creates a stretched condition:
- The distance from the 200-day moving average suggests extended momentum
- The rally into resistance was relatively fast, leaving limited nearby support
- Current price action shows hesitation just above the breakout zone
INTC Stock Seen as Buy on Pullbacks reinforces the tactical framework here - even in a constructive setup, the most favorable entries in INTC have historically come after controlled retracements rather than chasing extended moves.
Overbought conditions do not automatically signal reversal - but they do increase the likelihood of consolidation or a pullback before any sustained continuation.
The chart now revolves around one key behavior: acceptance above the former resistance near $50-$52. If INTC holds above that zone into the end of the week, the breakout gains credibility. If it fails, the structure risks turning into a false breakout - trapping late buyers and resetting momentum. The breakout is real, but confirmation still depends on whether price can hold where it matters most.
 Peter Smith


