 Marina Lyubimova
⬤ GOOG is taking a breather on the weekly chart after a solid run higher. The stock recently hit resistance and started drifting down toward a support area that technicians are watching closely. This looks like a classic Wave 4 pullback after the previous rally - exactly what you'd expect in a healthy uptrend.
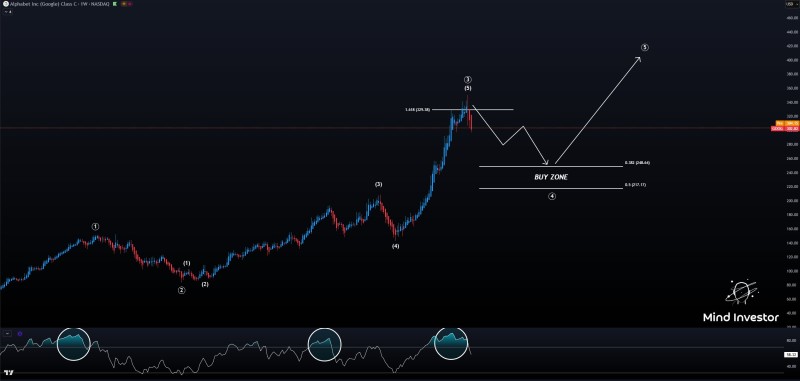
⬤ The chart shows a completed upward push through the earlier wave structure, and now price is expected to retrace into the 0.382 to 0.5 Fibonacci zone - that's roughly between $248 and $217. This range is being eyed as a potential landing spot if the decline plays out. There's also been some technical damage recently, with the stock breaking below a trendline it had respected for months, as noted in Google breaks below 50-day average after 8-month support streak.
⬤ Meanwhile, broader corporate moves are adding another layer to the picture. Alphabet's recent funding activity could inject some volatility during this correction phase, especially after the company announced plans for a $15 billion bond sale - details covered in GOOGL plans $15B multitranch bond sale.
⬤ Why does this matter? Wave 4 corrections usually come before the next leg up in a trend. If GOOG holds within that $217-$248 zone, the overall bullish structure stays intact and sets up for another potential move higher. But if it breaks below that range, traders might need to adjust expectations and prepare for a longer consolidation period instead.
 Marina Lyubimova


