 Peter Smith

⬤ Alphabet stock (GOOGL) has retraced into a key support zone marked as the "blue box" on Elliott Wave charts, trading around $306.24 after pulling back from recent highs. The support area spans from roughly $299.43 down to $285.89, and wave analysts are watching this zone as a potential swing-buy opportunity.
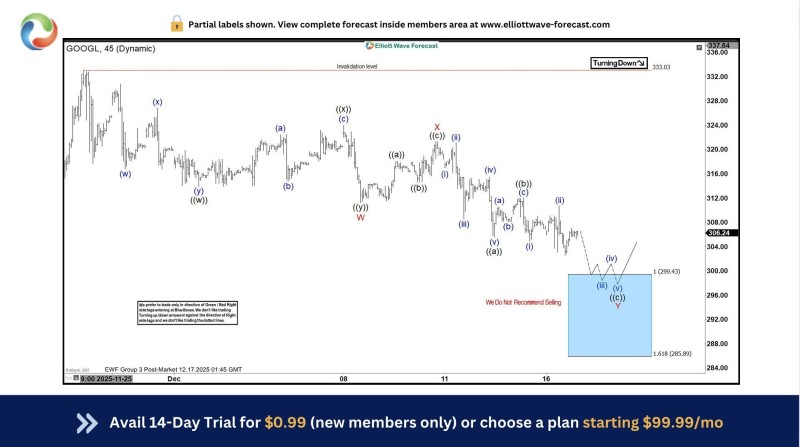
⬤ The chart shows the recent decline as part of a corrective wave pattern, with the final leg potentially unfolding inside this blue box zone where reversal probability is higher. The lower boundary aligns with the 1.618 Fibonacci extension near $285.89, while an invalidation level sits at $333.03—above this point, the current bearish correction structure would break down.
⬤ Analysts note "We Do Not Recommend Selling," emphasizing their focus on trading with the expected bullish continuation rather than shorting the pullback. The chart projects one more possible dip within the blue zone before upside resumes, with the "Turning Down" marker appearing near the earlier peak around $333.
⬤ This technical setup matters because Alphabet is one of the largest tech companies by market cap, and its price action often influences sentiment across mega-cap growth stocks. Traders are now watching whether GOOGL stabilizes in this support zone and resumes its uptrend, or continues consolidating within the corrective pattern.
 Peter Smith


