 Eseandre Mordi

⬤ AST SpaceMobile kept sliding after breaking below a critical technical marker on the daily chart. The stock turned bearish once it closed under the 1.0 Fibonacci level, and the selloff hasn't stopped since. Right now, $91 is being tracked as a possible bounce area.
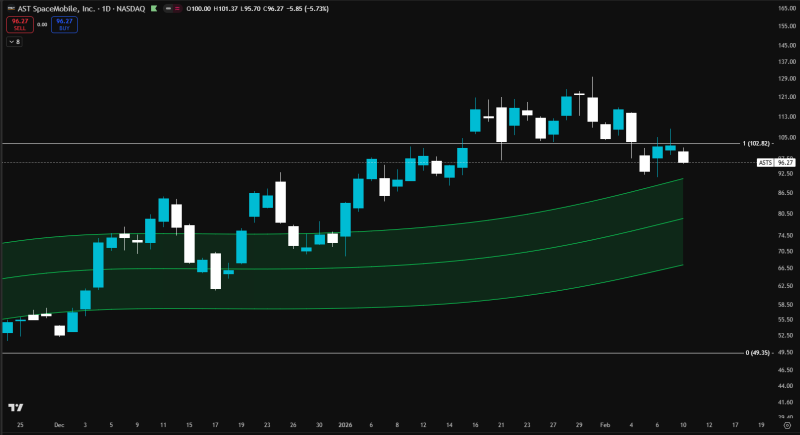
⬤ The chart shows ASTS trading near $96.27 after dropping below the horizontal level around $102.82—a zone that used to hold as strong resistance before momentum started fading. The latest session brought a sharp down move, with price drifting away from the prior range and getting closer to the upper edge of the green trend channel. This kind of pullback after failing to hold above a major level matches what happened before when a $90 support zone came into play after a key base broke.
⬤ For now, $91 is seen as a reaction area rather than a solid reversal level, with price still in correction mode after the breakdown. The broader chart structure shows ASTS is still inside an upward channel, but the recent string of red candles points to weaker momentum compared to the earlier rally. Similar action showed up during sharp pullback phases in ASTS after volatility spiked and when a $100-area backtest acted as a key decision point.
⬤ ASTS is now in a zone where short-term sentiment depends on whether price holds near the next support region or keeps pulling back within the channel. The $102–$103 area stands out as a level the market would need to reclaim to ease immediate downside pressure.
 Eseandre Mordi


