 Saad Ullah

⬤ AST SpaceMobile shares took a hit after dropping over 7% in a single session, pulling back to around $105. The stock broke beneath the blue conversion line on the daily chart—a signal that short-term momentum has shifted. This breakdown raises the odds of a drop toward the next support area near $91.
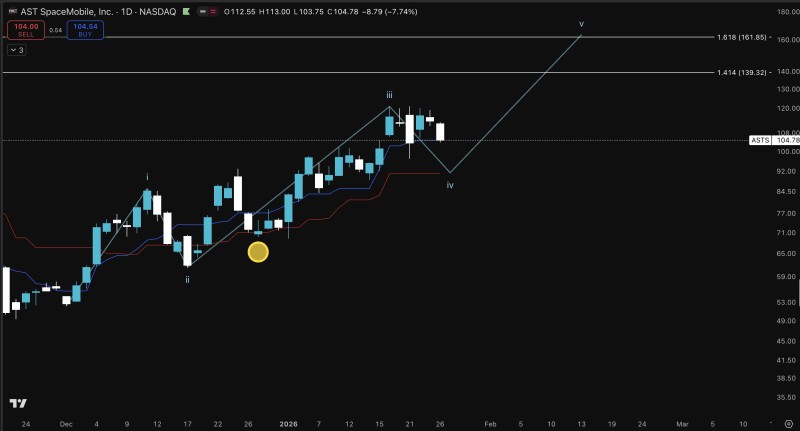
⬤ The chart reveals that ASTS had been riding high above $120 before this pullback started. Now that the conversion line has given way, the red base line becomes the key technical marker to watch. That base line sits right around the $91 zone, which appears to be the next stop if selling pressure continues.
⬤ Despite the recent weakness, the bigger picture still leans upward. The wave structure suggests this might just be a temporary correction rather than a full reversal. As one technical analyst noted, "the broader structure remains upward sloping, with longer-term projections extending toward the $140+ area." However, there's no timeline on that scenario, and right now the stock is clearly consolidating lower.
⬤ Why does this matter? How the stock behaves around the $91 support zone could determine whether the uptrend stays intact or if more downside is ahead. A bounce there might restore confidence, while a breakdown could trigger another leg lower. Either way, this level will likely shape near-term sentiment and set the stage for the next directional move.
 Saad Ullah


