 Alex Dudov

⬤ AST SpaceMobile shares are holding just under a critical resistance level that lines up with the stock's prior all-time high. The price remains stuck below the 1.0 Fibonacci level while the long-term $140+ target stays on the radar. The chart shows ASTS stabilizing around $102 after a powerful rally from roughly $50 to above $120 before pulling back to current levels.
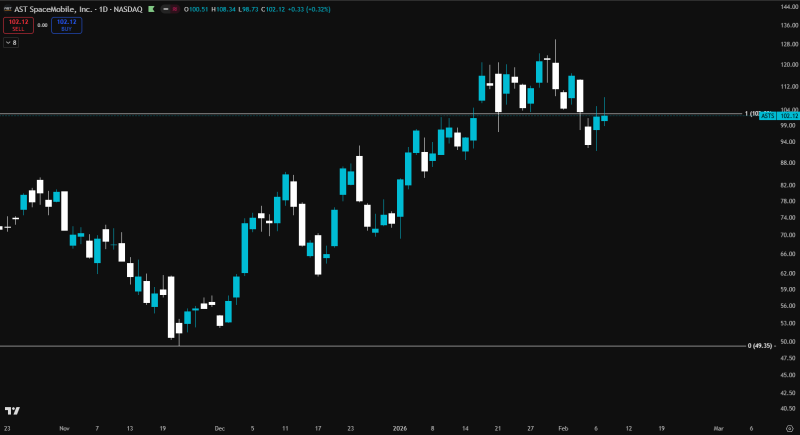
⬤ Right now, price action looks more like consolidation than any kind of reversal. After failing to hold above its previous peak, candles started forming a sideways pattern around the $100 zone. This behavior mirrors what happened recently when the stock struggled to clear its historical ceiling—similar to patterns described in AST SpaceMobile Hits Resistance Near $100, Eyes $140 Breakout. The inability to punch through this level keeps momentum on pause despite the bigger uptrend still being intact.
⬤ The broader structure remains upward compared to November levels, but the market has entered a reaction phase after the January spike. Comparable consolidation was outlined in ASTS Stock Holds Strong Uptrend as AST SpaceMobile Consolidates Near $100 and ASTS Stock Holds Bullish Signal After $100 Conversion Line Backtest, where price lingered around $100 following rallies toward $120. The chart now shows a similar pause below resistance rather than continuation.
⬤ When a stock keeps testing a prior all-time high like this, it usually determines whether the market resumes its expansion or gets stuck in a range. Holding near this level keeps the larger trend alive, while repeated rejection means consolidation could drag on across the space communications sector until a decisive breakout finally occurs.
 Alex Dudov


