 Peter Smith

⬤ Apple is pushing its long-running rally further, with weekly charts revealing a parabolic pattern that captures the company's impressive long-term momentum. Price is edging toward recent peaks near $282 while staying comfortably above key moving averages, painting one of the cleanest uptrend pictures in today's market.
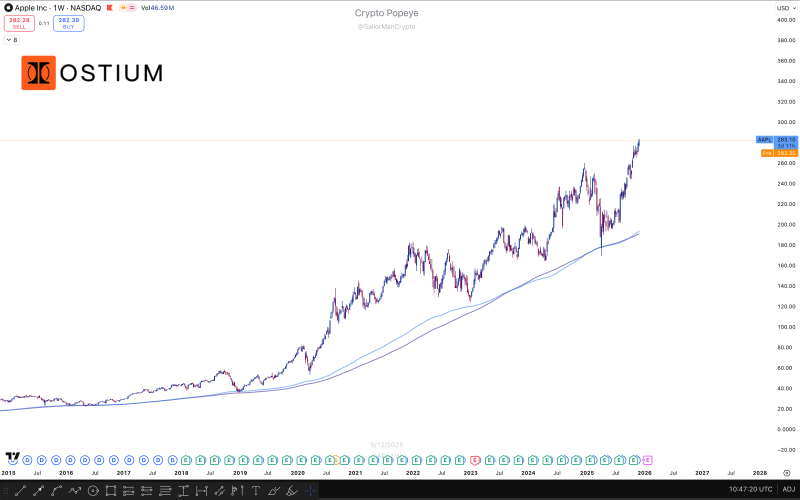
⬤ The weekly trend tells a story of multi-year strength, built on a reliable series of higher highs and higher lows. Price continues holding well above long-term moving averages, cementing Apple's commanding bullish position. This kind of strength makes betting against it look risky—there's simply no real weakness or reversal pattern showing up on the higher timeframe.
⬤ Looking at shorter timeframes, the 1-hour chart mirrors the broader weekly strength. Repeated re-accumulation patterns keep appearing on the hourly view, signaling continued internal power as Apple grinds higher. Still, chasing extended green candles or trying to short prematurely isn't the smart play here. Better opportunities might come from waiting for price to pull back and retest the 1-hour trend zone, ideally with a fresh re-accumulation setup before the next leg up.
⬤ Apple's strength across multiple timeframes reinforces its standing as one of the market's most reliable large-cap performers. The parabolic structure supports the bullish mood across major U.S. indices, while elevated prices suggest patience is key for traders looking for well-timed entries aligned with the dominant trend.
 Peter Smith


