 Peter Smith

⬤ Apple Inc. (AAPL) is getting attention from technical analysts after a new chart breakdown showed the stock trading around $273.81 with a "ZONE +3.00" bullish reading at the top of the dashboard. The chart shows AAPL has been in a solid uptrend since August, though it recently pulled back toward short-term moving averages as the year winds down.
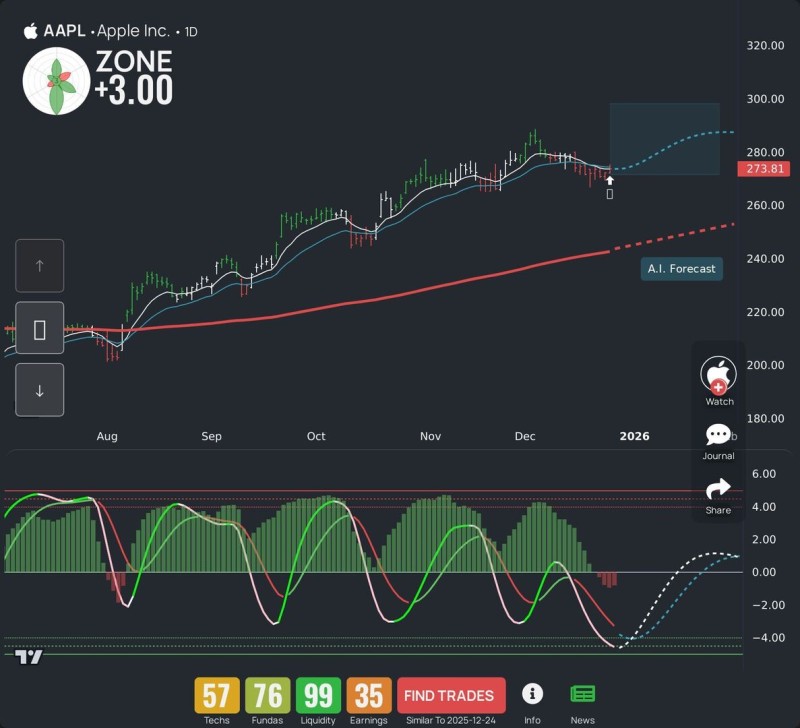
⬤ The chart displays price candles alongside light blue and white moving averages sitting above a longer-term red line that's been climbing steadily since summer. What stands out is the AI Forecast box on the right side, which projects a recovery path into early 2026. That dotted line curves upward toward the $280 to $300 range, with AAPL currently sitting near the lower end of that zone.
⬤ Below the main chart, an oscillator panel shows green and red bars with crossing lines tracking momentum cycles in AAPL. The indicator recently turned up from lower levels, and the projected path points higher, matching the AI price forecast. Dashboard metrics at the bottom rank Techs, Fundas, Liquidity, and Earnings, with Liquidity scoring highest at 99. The whole setup suggests a data-backed approach rather than pure speculation.
⬤ This matters because Apple is one of the biggest stocks in global markets, so shifts in AAPL's technical picture can ripple through broader investor sentiment. An AI projection pointing toward stabilization and upside keeps the focus on Apple as a key benchmark. How the stock trades relative to current trend lines and that projected range could shape near-term expectations for the wider market.
 Peter Smith


