 Saad Ullah

⬤ AMD is approaching a critical technical juncture as the stock trades around its 50-day moving average near $220. After pulling back from the upper trendline zone, the stock is now stabilizing near a cluster of support levels. The chart shows a sharp decline from the latest swing high, bringing price action directly into an area marked by both moving averages and a key reaction zone.
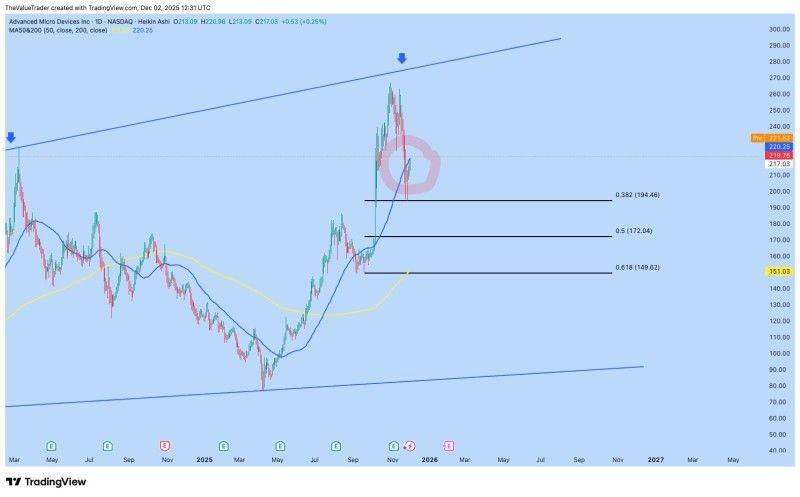
⬤ The pullback from the $290 area has brought AMD into the $217–$220 zone, where buyers are attempting to regain control. Below this region, Fibonacci retracements mark potential support levels at $194.46 (0.382), $172.04 (0.50), and $149.62 (0.618). The stock's interaction with rising short-term moving averages makes the $220 level the immediate reference point for near-term momentum.
⬤ The broader trend structure for AMD remains intact despite recent volatility. The stock previously hit long-term channel resistance before sliding toward intermediate support zones, and current price action shows an attempt to stabilize within this technical framework. Whether AMD can maintain its position above the 50-day moving average may determine if sentiment shifts toward recovery or if the stock drifts toward deeper retracement levels.
⬤ This moment could define AMD's next directional phase. A close above $220 would signal stabilization following the recent decline, while failure to hold this level could introduce additional downside pressure. The coming sessions will reveal whether buyers regain strength or if the correction extends further into support zones.
 Saad Ullah


