 Usman Salis

AMD just gave traders exactly what they were hoping for—a clean bounce off support. After dipping to $235 in early November, the stock found strong buying interest and rebounded decisively.
The Technical Picture
As highlighted by Don't follow Shardi B If You, that level turned out to be a "steal," and the chart now suggests bulls are back in the driver's seat. With semiconductors catching a bid again and AI stocks regaining momentum, AMD's rebound couldn't have come at a better time.
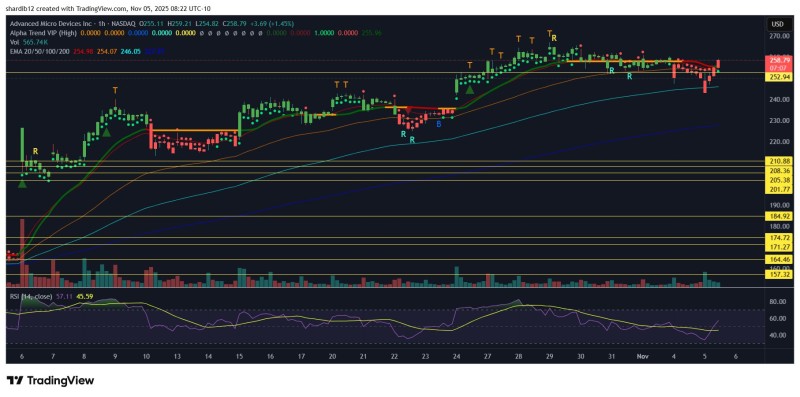
The one-hour chart tells a clear story. AMD tested the $235–$240 zone—reinforced by the 200-period EMA—and buyers showed up in force, pushing volume noticeably higher. Since then, AMD has reclaimed its 20- and 50-period moving averages around $255, a short-term bullish signal that often leads to further gains. The chart is also littered with reversal and buy indicators near $235, confirming strong market reaction at that level.
Here are the key levels to watch:
- Immediate resistance: $260–$262, where the last local top formed
- Support zone: $235–$240, now validated as a strong buy area
- Next major support: $210–$215, if things reverse again
The RSI has climbed from oversold territory (around 35) back up to 57, showing improving momentum. Short-term moving averages are starting to slope upward, signaling a shift from consolidation to recovery. As long as AMD holds above $250, the technical setup looks solid.
What's Driving the Move?
AMD's bounce isn't happening in a vacuum. The whole semiconductor sector is rallying as investor sentiment improves, helped by better macro data and calmer bond yields. AMD is also riding strong expectations around its MI300 AI accelerators and growing demand for high-performance computing. With money flowing back into AI infrastructure plays, AMD is right in the sweet spot.
 Usman Salis


