 Saad Ullah

Advanced Micro Devices (NASDAQ: AMD) is showing solid momentum right now, clearing through Fibonacci retracement levels that short-term traders rely on for direction.
AMD Technical Breakdown: What the Charts Are Saying
According to analysis from Tamir T. and the Fibonacci Elite Traders community, AMD's chart is pointing toward higher prices, with $230 becoming a realistic near-term target.
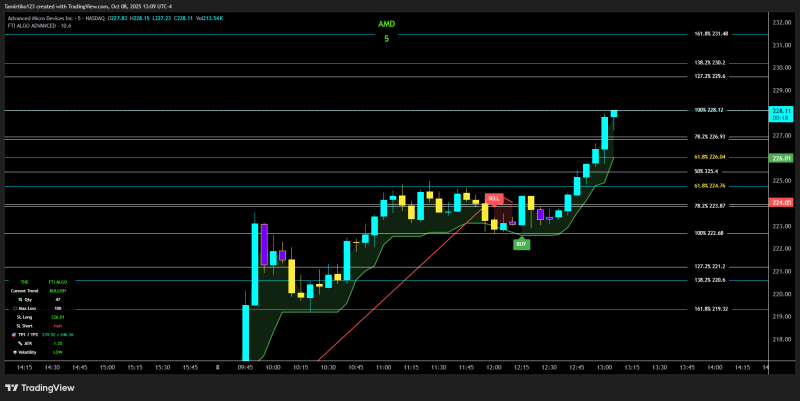
Here's what's happening with AMD's price action:
- Support reclaimed: AMD bounced back above the 61.8% Fibonacci level at $226, which is now acting as a floor
- Current position: Trading at $228.11, right at the 100% Fibonacci extension ($228.12)
- Next stops: If buyers stay in control, the chart suggests $230.20 and $231.48 as upcoming resistance areas
- Momentum indicators: A bullish algorithm signal is active, with low volatility and an ATR of 1.25 showing steady but controlled movement
- Downside watch: If things reverse, support sits at $226.04 and $224.76, giving traders clear exit points
Why This Matters
Traders are paying attention to AMD for a few reasons. The Fibonacci setup gives them specific price levels to work with, which makes planning trades easier. Semiconductors are back in the spotlight thanks to AI demand and a broader tech rebound. And with the overall market holding up well, setups like this one tend to attract serious volume.
AMD has climbed back strongly and is now testing resistance between $228 and $230. If it breaks through cleanly, the next leg could push toward $231.50 or higher, adding more fuel to the bullish case for chip stocks overall.
 Saad Ullah


