 Usman Salis

AMD has been building momentum through late October, carving out a bullish pattern that has traders buzzing ahead of Tuesday's earnings report. With a textbook cup-and-handle formation in play and volume staying supportive, AMD looks primed for a potential breakout if earnings deliver.
The Setup
The stock is sitting just below key resistance at $275, and according to John The Rock Trading Co. , "the move isn't complete"—hinting that more upside could be coming.
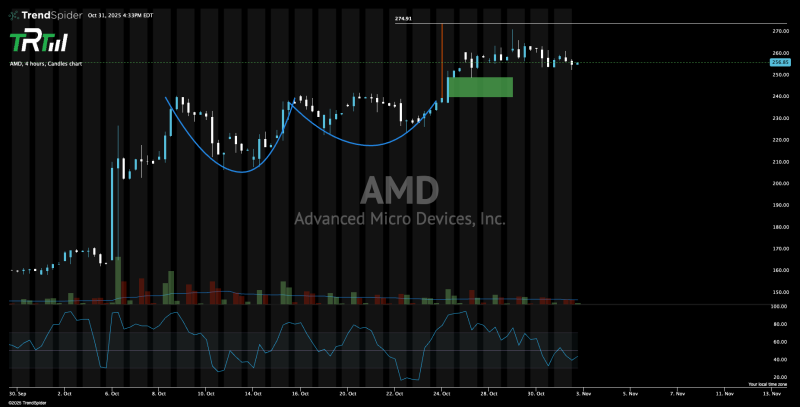
AMD's 4-hour chart shows a clean cup-and-handle pattern—a classic bullish signal that typically comes before a continuation rally. Here's what stands out:
- Cup Formation: AMD carved out a rounded bottom between October 10–22, signaling that selling pressure has dried up and buyers are stepping back in
- Handle & Support: The pullback forming the "handle" has held steady around $250–$255 (the green support zone), which is a healthy pause before the next leg up
- Resistance Level: The breakout point sits at $274.91—clear it, and the pattern confirms
- RSI Reset: The Relative Strength Index has cooled off to neutral territory, which often sets the stage for another push higher
- Volume Profile: There's been minimal selling during consolidation, suggesting quiet accumulation by stronger hands
- Upside Targets: If AMD breaks out, the measured move points to $285–$290 in the short term
- Fundamental Backdrop: AI and data center demand continue to fuel optimism, with AMD's MI300 chips gaining traction in enterprise and cloud markets
Bottom Line
AMD's chart structure, momentum indicators, and positioning all point toward a bullish setup heading into earnings. If buyers push the stock decisively above $275, a quick move to the $285–$290 zone looks realistic. With earnings just around the corner and a solid technical base forming, Tuesday could define AMD's next major move.
 Usman Salis


