 Usman Salis

Amazon (AMZN) shares are approaching a make-or-break moment. After months of steady gains, the stock is once again pressing against a stubborn resistance zone that has held firm on multiple attempts. The next move will likely determine whether AMZN has the strength to push toward $300 or if sellers will force a reversal back down.
AMZN Chart Analysis
The technical picture reveals a complex setup with clearly defined battle lines. According to EK trader's analysis, the resistance zone between $235–$242 has acted as a ceiling on several occasions, creating a critical inflection point. A confirmed breakout above this level could unleash momentum toward $264 and potentially the $292–$300 range, aligning with key Fibonacci extension targets.
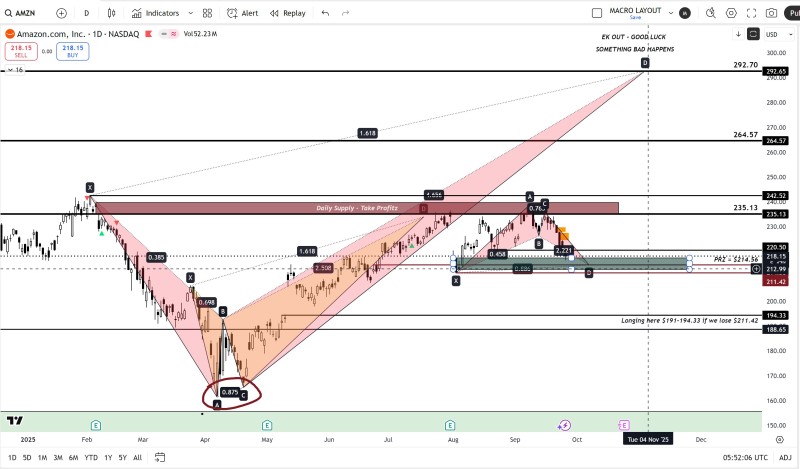
On the downside, strong support sits around $212–$214, marked as the Potential Reversal Zone (PRZ). Should the stock break below $211, it could trigger a deeper pullback with buyers likely positioning themselves around the $191–$194 area. Since bouncing from April lows near $170, AMZN has constructed an impressive uptrend, but repeated rejections at resistance demonstrate that sellers remain active and willing to defend higher levels.
Market Context
- Fundamental support: AWS cloud growth, AI integration advances, and improved operational efficiency
- Risk factors: Rising bond yields, consumer spending concerns, tech sector volatility
- Technical setup: Third test of resistance often proves decisive in trend continuation patterns
This represents a pivotal moment for Amazon stock as it stands at the crossroads between breakout and breakdown. If bulls can flip the $235–$242 zone into support, momentum could carry the stock toward the psychologically important $300 level. However, failure at this juncture would increase the probability of a retreat toward $211 and potentially the $191–$194 support zone.
For investors watching this setup unfold, the coming sessions will likely provide clarity on Amazon's direction heading into 2025.
 Usman Salis


