 Eseandre Mordi

⬤ The U.S. Dollar Index (DXY) has broken below its March 2022 low, sliding to around 96.19 from levels near 96.62. The dollar has shed nearly 13% over the past year, representing a major turnaround from the highs hit during the previous tightening cycle. The chart shows a clear downtrend with recent price action confirming the breach of a critical support level not seen in nearly three years.
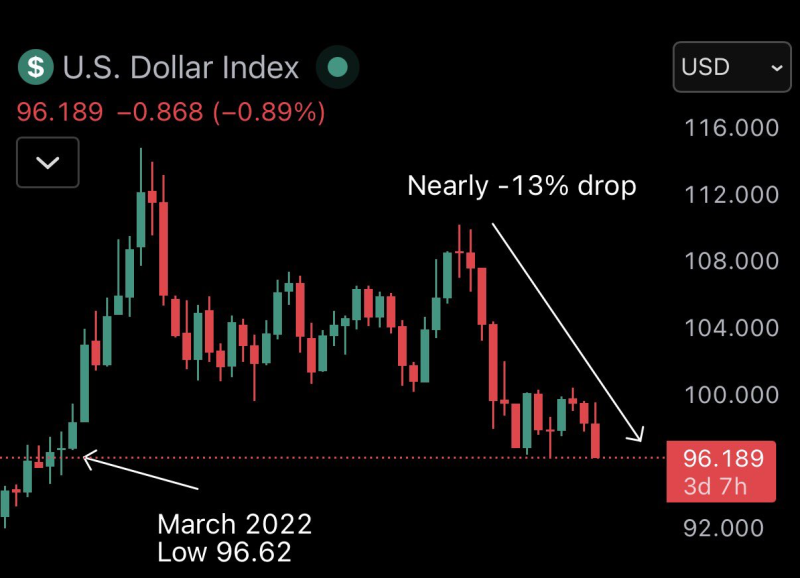
⬤ The DXY peaked above 110 before entering a sustained pattern of lower highs and lower lows. Recent candles show downside pressure continuing, with the index now sitting at levels last touched almost three years ago. This breakdown below the March 2022 low highlights how deep the current pullback has become and signals a real shift in currency market dynamics.
⬤ The weakening dollar has lined up with explosive moves in precious metals. Silver has jumped roughly 267% over the past year, while gold has climbed about 84%. These gains have unfolded alongside the dollar's drop, reinforcing the inverse relationship typically seen between the DXY and hard assets. While many factors drive commodity markets, dollar weakness has been a major theme throughout this stretch.
⬤ The latest DXY move matters for global markets given the dollar's role as the world's primary reserve currency. A sustained break below long-term support could shape trends across currencies, commodities, and risk sentiment. With the dollar now trading beneath its 2022 lows, traders are watching closely to see if this signals an extended period of weakness or a potential bottom after an unusually steep decline.
 Eseandre Mordi


