 Marina Lyubimova
⬤ The S&P 500's Shiller P/E ratio just rocketed to its second-highest point ever, sitting at around 40.74. The only time it's been higher? During the Dot-Com bubble's insane peak in the late 1990s. Stock prices are reaching levels we haven't seen in decades, and it's got investors wondering if we're headed for another meltdown.
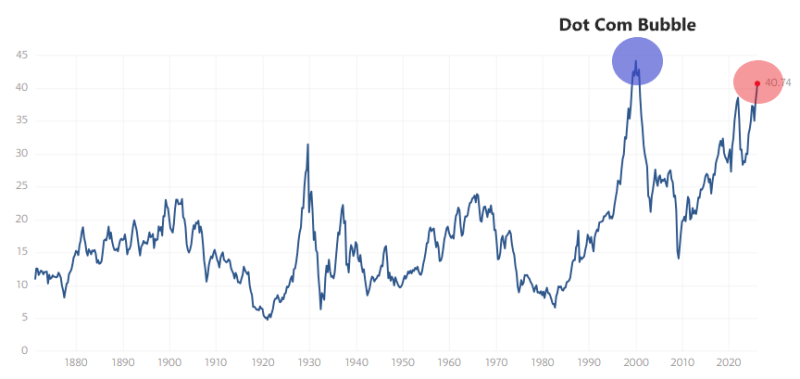
⬤ Here's the thing about the Shiller P/E ratio—it's not your typical price-to-earnings measurement. It smooths out the noise by adjusting for inflation and averaging earnings over 10 years. Right now, it's screaming that stocks might be seriously overpriced. We're talking valuations that mirror the 2000 tech bubble when everyone thought the internet would make traditional business metrics irrelevant.
⬤ These sky-high numbers are raising serious red flags about whether this rally can actually last. Sure, elevated valuations sometimes just mean investors are confident and the economy's humming along. But history tells a different story—after the Dot-Com crash and the 2008 financial crisis, high Shiller P/E ratios came crashing down hard. With the ratio at 40.74, there's growing worry we might be dancing on the edge of a cliff.
⬤ What makes this moment so significant is that it suggests the market could be getting dangerously stretched. Investor optimism is great until it's not, and current valuations could either keep climbing or come crashing down to reality. The big question everyone's asking: can the market actually sustain these levels, or are we watching another bubble inflate before our eyes? Either way, buckle up—things could get bumpy.
 Marina Lyubimova


