 Usman Salis

⬤ U.S. inflation readings based on high-frequency pricing data show softer price growth than official figures. The TruCPI index sits at 0.74% and TruPCE at 1.27%—both well below the Bureau of Labor Statistics' most recent CPI reading of 2.7% for December.
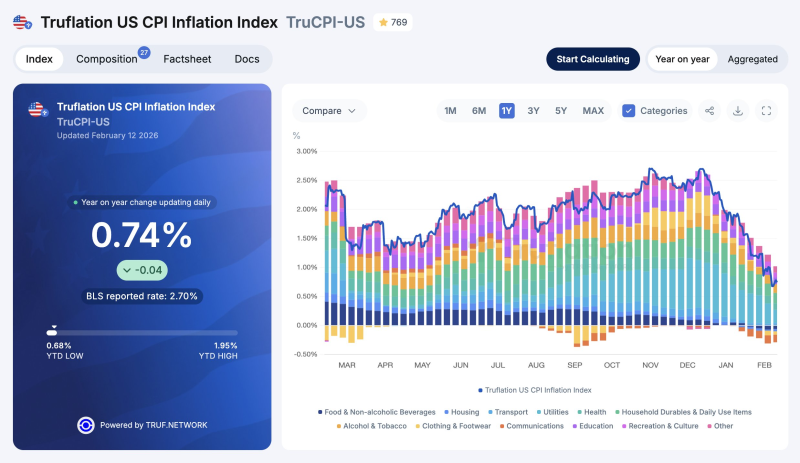
⬤ The CPI chart shows broad declines across housing, transport, and discretionary spending. Daily price updates capture recent shifts faster than traditional monthly surveys. A similar split between real-time and official data appeared when the US inflation gap hits 200 basis points.
⬤ The PCE series reflects the same cooling trend, gradually sliding toward roughly 1.3% after higher readings earlier in the year. Comparable easing signals showed up when US CPI inflation drops to 1.23% as real-time data signals cooling price pressures.
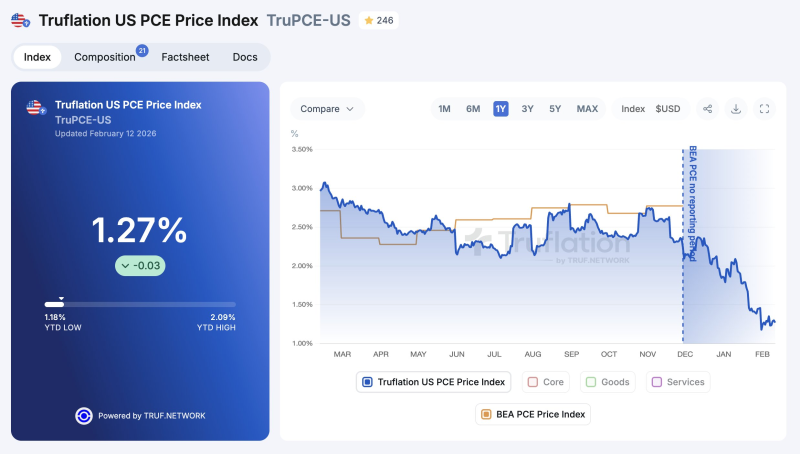
⬤ The upcoming official inflation release will show whether government measures start reflecting the same disinflationary trend visible in daily price tracking. Convergence would signal alignment between real-economy pricing and reported macroeconomic indicators. Continued divergence would reinforce the lag between economic conditions and published statistics.
 Usman Salis


