Peter Smith
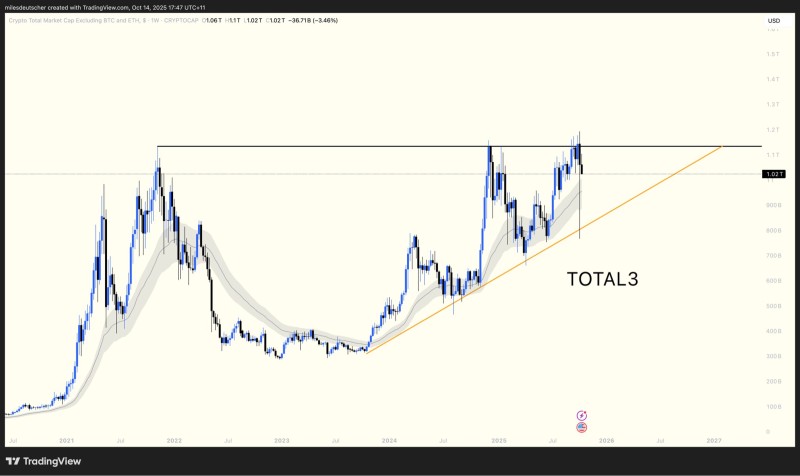
The TOTAL3 market cap, which tracks all cryptocurrencies except Bitcoin and Ethereum, has been building momentum but keeps hitting a wall at the $1.1 trillion mark. While this might look like steady progress on the surface, some market observers are raising questions about what these numbers actually mean. The constant flow of new tokens entering the market can make things look healthier than they really are, which is why taking a closer look at the data matters more than ever.
Why TOTAL3 Might Not Tell the Whole Story
Here's the thing about TOTAL3: it counts every single altcoin out there, including brand-new launches that pump up the numbers without necessarily reflecting real growth. As trader Miles Deutscher points out, this means the market cap can climb even when older, established coins are actually losing ground.
A more honest view comes from watching OTHERS/BTC, which compares the entire altcoin basket directly against Bitcoin. This pairing cuts through the noise and shows whether altcoins are genuinely gaining traction or just getting diluted by an endless stream of new tokens.
The Technical Picture: Bulls Struggling at Resistance
The weekly chart shows a solid uptrend dating back to mid-2023, with prices climbing along a rising support line. But there's a catch: every time the market pushes toward $1.1 trillion, it gets rejected. Support sits around $900 billion to $950 billion, right where that trendline runs. Resistance? That's the stubborn $1.1 trillion ceiling that's been holding things back. The momentum looks decent overall, but the fact that bulls can't punch through suggests we might be in for some sideways action before the next big move.
The weekly chart shows a solid uptrend dating back to mid-2023, with prices climbing along a rising support line. But there's a catch: every time the market pushes toward $1.1 trillion, it gets rejected. Here's what the technicals are showing:
- Support levels: Around $900 billion to $950 billion, right where the ascending trendline runs
- Resistance levels: The stubborn $1.1 trillion ceiling that keeps capping upside moves
- Momentum: Decent overall, but the inability to break through suggests possible sideways consolidation before the next big move
What This Means for Your Portfolio
If buyers manage to crack that $1.1 trillion level and hold it, there's room to run toward $1.3 trillion, similar to what we've seen in past cycles. But if they can't, expect a pullback toward $900 billion, where the structural support should kick in. For anyone investing in altcoins, relying on TOTAL3 by itself is risky. It can give a false sense of strength that doesn't match reality. Tracking both TOTAL3 and OTHERS/BTC together gives a much clearer picture of whether altcoins are actually outperforming or just treading water. In a market driven as much by sentiment as by fundamentals, understanding this difference could make or break your strategy.
 Peter Smith