 Usman Salis
⬤ USD/JPY took a sharp dive lower, sliding down to the 0.618 Fibonacci retracement of 2024's sell-off and landing right at a former resistance zone around 153.41. The pair hit this critical technical level after a brutal sell-off heading into last week's close. Charts show just how fast the decline happened, with the retracement level and historical resistance now converging at the same spot.
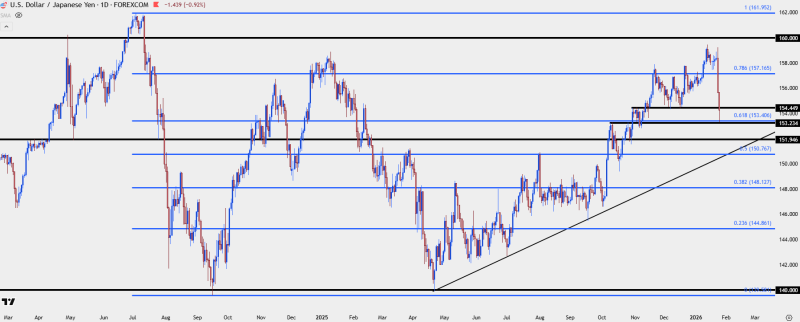
⬤ The move saw USD/JPY pull back hard from recent highs near 160.00, breaking through several support levels before catching its breath around 153.40. Sharp red candles on the chart tell the story of an aggressive downturn that followed a long climb higher, making this reversal particularly striking in both speed and scale.
Moves potentially linked to intervention can be uneven and volatile, but the emphasis remains on price behavior around current levels.
⬤ Traders are now watching to see if USD/JPY faces fresh selling pressure on any bounce toward the 154.45-155.00 zone. This area sits just above the current retracement level but below recent swing highs, making it a crucial test zone. The chart marks this as a key battleground where price action could reveal whether sellers are still in control after the initial plunge.
⬤ The timing has caught attention too, as the sell-off picked up serious momentum heading into last week's end. How USD/JPY behaves near this former resistance and the 0.618 retracement could shape short-term market direction following such an abrupt decline.
 Usman Salis


