Chart patterns are nifty tools used to craft trading strategies, determine entry and exit points of trade, and how to make a profit or reduce losses on a trade. There are different types of patterns analyzed for information but our focus today is on the bullish patterns in forex charts.
What are Bull Patterns in Forex Chart?
A bullish pattern is a continuous pattern that forms when there is a brief pause in a price trend before it experiences a strong upward trend. There are different forms a bull pattern might take, and two of the most common bullish patterns are the bull flag and the bullish pennant. Let's discuss them briefly:
Bull Flag
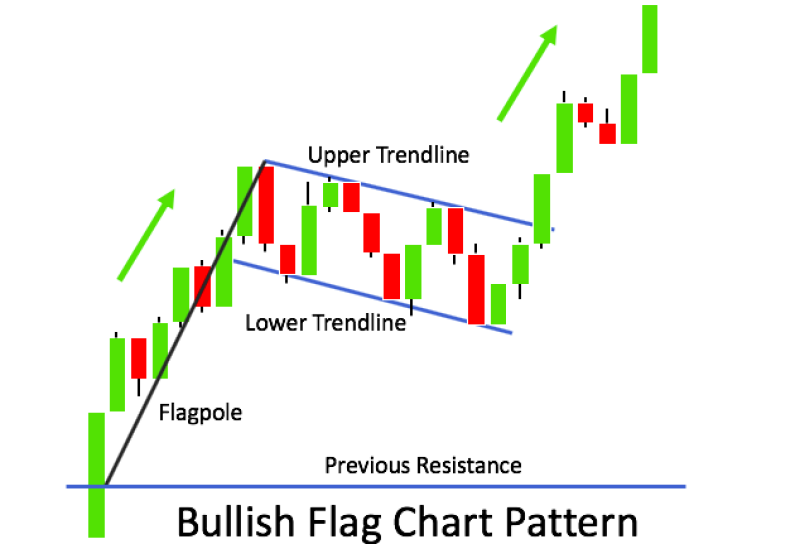
The bullish flag gets its name from its appearance. It usually comprises a downward sloping rectangle with a pole attached to it. The price of the asset bounces inside the area created by the two parallel lines of the flag before breaking out into a strong upward movement.

The flag pole is typically a preceding uptrend where the price experienced higher highs and high lows before entering a period of consolidation creating the Flag itself. The flag pole also represents a short trend and the trading signal provided by this pattern depends on how tight the flag is.
The Bullish Pennant
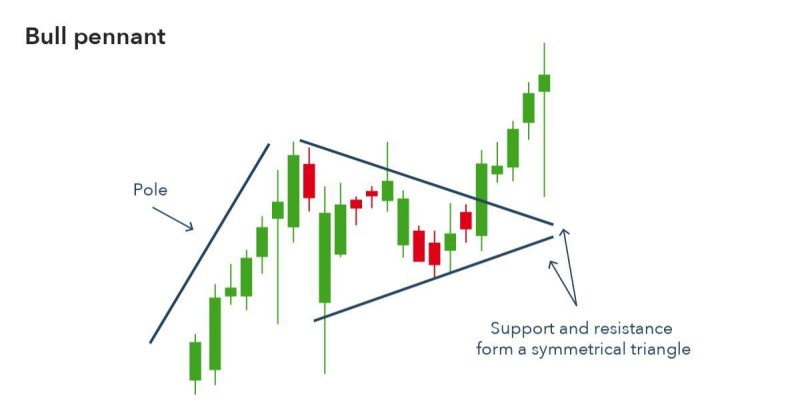
The bullish pennant is a continuous technical trading pattern that shows a strong breakout by price action after a period of consolidation. Like the flag, the pennant also has a flag pole, a short-lived trend with higher highs and higher lows, and the main difference between the two patterns is that the pennant comprises of two lines converging at a point before the breakout happens instead of two parallel lines. Plus, it looks like a triangle with a falling resistance and rising support.
The bullish pennant helps traders to determine which stage the price action was in before its strong upward breakout. While the price action bounces within the converging lines, traders may want to avoid making risky trades as the pattern may reverse before the price moves upward.
Some other types of bullish signals/patterns indicating price reversal upward are:
Hammer: This is a 1 candle pattern that occurs where the lower part of the candlewick is longer than the body. For an inverted hammer, the upper candlewick will be longer.
Piercing line: This is a pattern consisting of 2 candles, 1 bullish and the other bearish. The signal provided by this pattern is strong because it shows that traders were able to turn the situation around and make gains after a bearish impulse.
Bullish Harami: This is a 2 candlestick pattern, and the body of the first candle, either bullish or bearish, is greater in size than the second candle. There is rarely a situation where two bullish candles will appear before a price reversal.
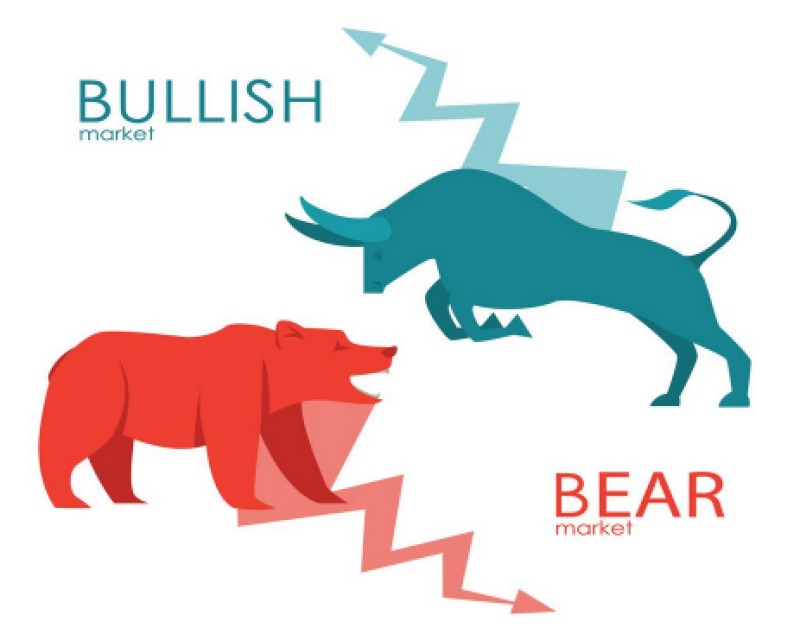
What makes a bullish pattern is a breakout into an upward movement, and if the opposite happens, then it is a bearish pattern. This is why it is important to discuss the distinguishing differences between bearish and bullish patterns.
Bullish v Bearish Patterns
As discussed earlier, a bullish pattern occurs when the price of a currency pair is rising or expected to rise, with traders' optimism and confidence in the strong uptrend being major characteristics of the market.

A bullish pattern could go on for weeks or months, and in a volatile environment like forex, it may only last for a couple of days. However, a bearish pattern is typically characterized by falling prices, and traders are quicker to sell their positions to avoid making significant losses rather than buying. This pattern can also be a result of the actions of traders because when a large number of traders sell off a currency pair expecting its price to drop, it will eventually cause the price of the asset to drop rapidly.
Bullish and bearish patterns typically bear the same forms but with slight differences. For instance, a bearish flag has the same characteristics as a bullish flag, but the flag itself has an upward slope and a strong downtrend.
Despite their differences, both bullish and bearish markets have their advantages, and with a good trading strategy, a shrewd trader can make profits from both markets.
Reading Bull Patterns in Forex Charts
We're going to discuss this in relation to both the bull flag and bullish pennant.
Bullish Flag
The first step to reading bull patterns in the forex chart is to identify the bull flag, and this may be a bit complex due to the many characteristics that need to be detected.
First, a preceding upward trend to serve as the flag pole must be identified, followed by a period of consolidation marked out by parallel support and resistance line.
The diagonal price movement within the support and resistance should not retrace more than 38%-50% of the upward movement ( that is, the trend identified as the flag pole), and if it continues to go lower, it may no longer be used as a flag. The bull flag can come in different sizes, but the typical pullback will last 3 periods. For instance, if you are using an hourly chart, the pullback will last 3 hours, and if you're looking at a weekly chart, the pullback will last 3 days. The pattern is complete when the price closes above the diagonal resistance level and finds new levels of support and resistance.
A break upward is typically a sign to buy and traders may want to look out for higher than average volume of the currency pair to ensure that the asset will keep rising upward. You can determine to sell signals by setting a price target which can be the high of the initial upward movement (the highest part of the flag pole). The price target could also be the price at the resistance level before the breakout or the price at the support line.
If the price pattern were to fall instead of rising as expected, traders typically have a risk management tool like stop-loss to reduce the loss that would have occurred on such trade. As long as all the relevant criteria for identifying a bull flag pattern are met, it can be a reliable technical analysis tool in the arsenal of any trader.
Bullish Pennant

It is suitable for most time frames, especially the lower time frames required for day trading.
The lower highs and higher lows in the consolidation period eventually culminate into the converting point of the pennant pattern.
Look out for a flag pole which could be an uptrend lasting for a couple of days, weeks, or a month, the pennant itself (a consolidation period), and a breakout. Based on how strong the flag pole is, the pennant will be high and tight, and after the continuous stalemate within the consolidation period, the price may see a strong uptrend because of traders' strong desire to purchase the currency pair while its price is at a low point.
When it becomes strong enough to break through the pennant, you may want to buy or wait to see if it will continue to trend upward. It is also advisable to examine how deep the price action within the convergence period is before breaking out to determine whether there would be a reversal.
To reduce the possibility of loss, a stop-loss order can be placed close to the point of the breakout, or at the bottom of the support line, depending on the level of risk you're willing to take. Target price levels can be set by measuring the distance between the highest point of the flag pole and the resistance line of the pennant itself. Other risk management tools can be used because the forex market doesn't always work the way you predictable traders need to protect themselves from costly risks.
Conclusion
Bullish patterns are signs that the forex market is moving in a positive upward direction, and while it may provide a good environment for traders to make a successful trade, that upward movement could be quickly reversed and result in losses. To prevent this, understanding bullish patterns and knowing how to read them becomes important to protect yourself and the profits already made from trading.
If you're considering starting to trade, choosing the right broker that fits your needs and preferences is essential. There are many brokers out there, each with advantages and disadvantages. To make an informed decision, it's a good idea to read comparatives that compare different brokers based on factors such as fees, trading platforms, customer service, and regulatory compliance. By doing so, you can get a better sense of which brokers offer the features and benefits that align with your trading goals and risk tolerance.
 Editorial staff

 Editorial staff


