 Saad Ullah

EUR/USD has reached a decisive technical point after several volatile sessions. The pair's recent bounce follows a sharp rejection from a higher supply area marked by a Fair Value Gap (FVG), indicating that liquidity imbalances continue to shape the short-term structure.
Technical Structure Between IRL and ERL
The chart shows a clean candlestick pattern typical of liquidity-based analysis. After forming consecutive higher lows last week, EUR/USD encountered strong selling pressure when entering the FVG zone near 1.0890–1.0910. This rejection pushed price lower toward the mid-range area, where it's now stabilizing close to the intermediate resistance level.
Trader MR | EUR highlighted this development in a recent update, noting that price reaction at the Intermediate Resistance Level (IRL) could determine the next directional move.
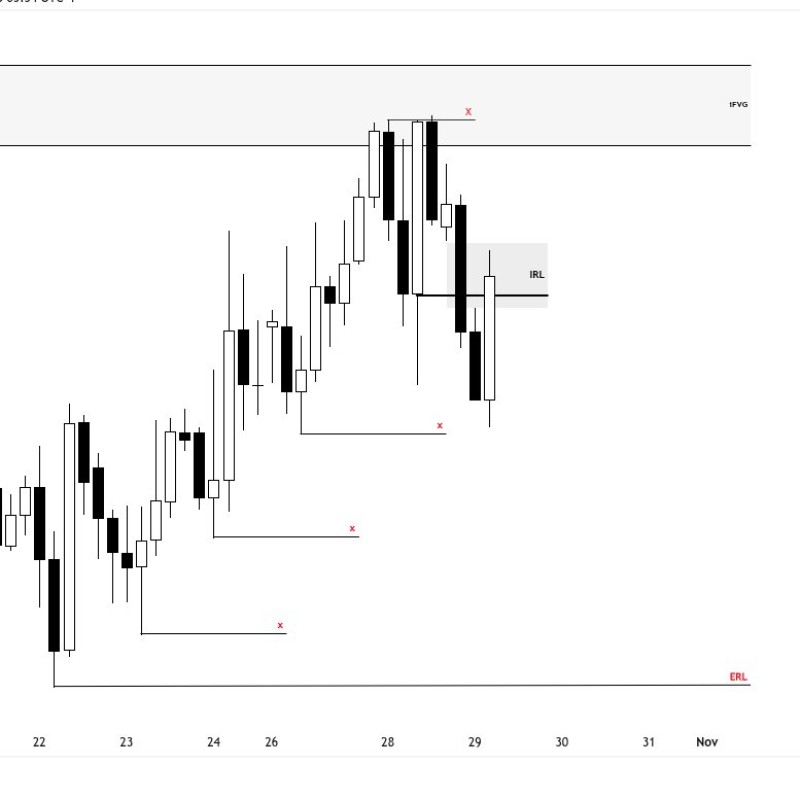
Key chart observations include:
- FVG Zone: Upper liquidity pocket near 1.0890–1.0910, acting as a supply region where sellers previously entered
- IRL (Intermediate Resistance Level): Around 1.0840–1.0860, currently being tested by intraday candles
- ERL (Equal Range Low): Around 1.0760, serving as a lower liquidity target if downside pressure returns
The latest candle displays a rejection wick with partial recovery, reflecting buying activity trying to absorb prior selling momentum. Still, the structure remains neutral to slightly bearish until the pair holds above the IRL region.
Dollar Strength Limits Euro Upside
The euro's technical bounce faces headwinds from a resilient U.S. dollar, backed by firm Treasury yields and cautious Federal Reserve commentary. At the same time, European Central Bank officials have adopted a more dovish stance amid weakening manufacturing activity across the eurozone, which caps the euro's near-term potential. Market sentiment stays mixed as traders balance soft eurozone data against stronger U.S. growth signals, keeping EUR/USD trapped between key liquidity levels throughout late October.
 Saad Ullah


