 Saad Ullah

⬤ EUR/USD gained strength recently as the pair confirmed a clean bullish setup visible on both daily and 4-hour charts. The price pushed past earlier resistance zones and kicked off a fresh upward leg after breaking important structural points. The move came right after EUR/USD bounced from a key imbalance zone, lining up perfectly with the bigger trend direction.
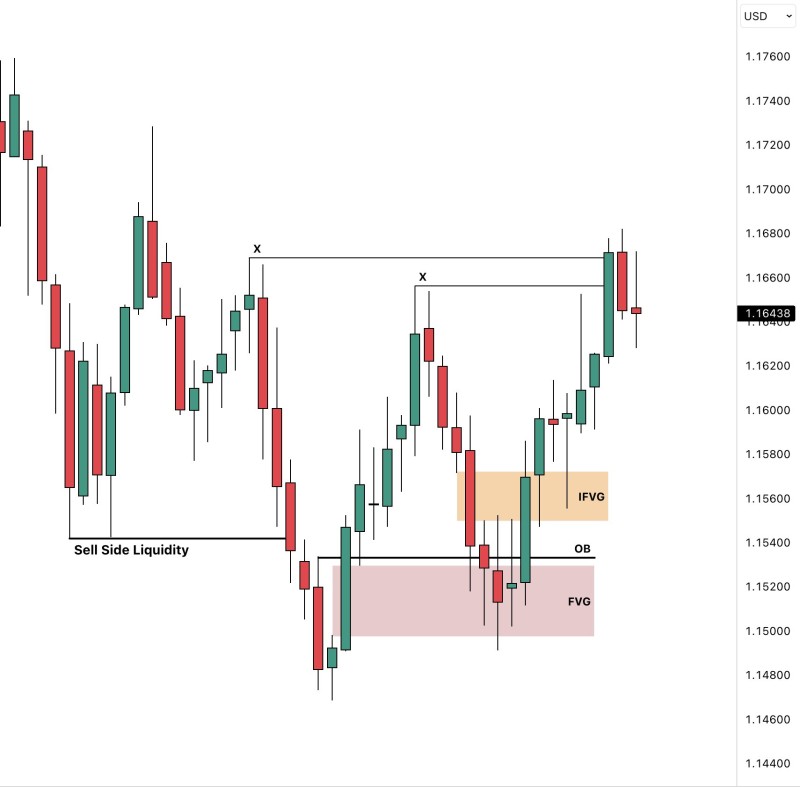
⬤ The chart shows EUR/USD first grabbed liquidity on the downside before making a sharp move up that created new imbalance areas on shorter timeframes. Price then moved into a fair value gap while touching an order block, setting up the foundation for more upside. The pair worked through previous gaps and moved toward IFVG and FVG zones, which provided support during the rally. This step-by-step climb shows a controlled push toward higher liquidity levels, matching the expected market flow.
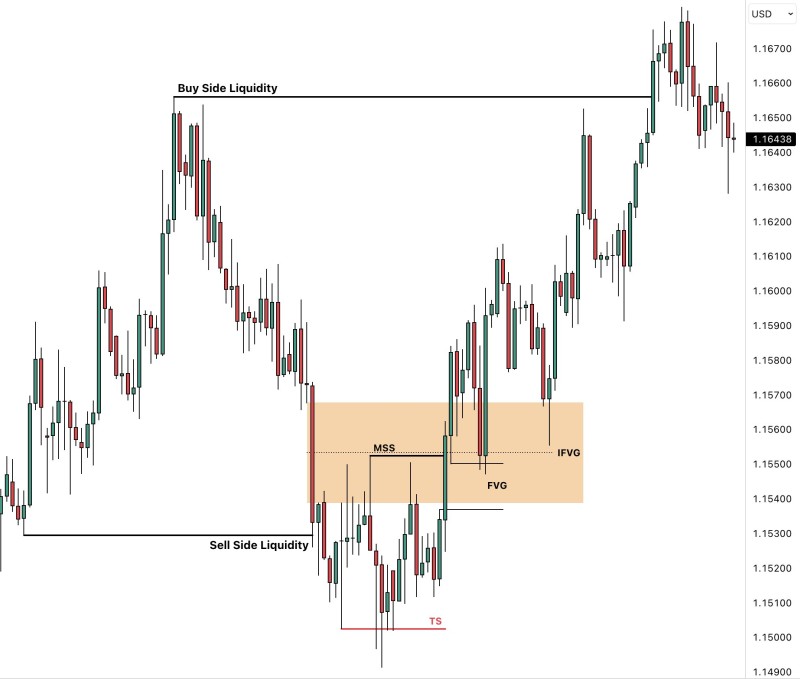
⬤ As things played out, EUR/USD showed a clear shift in market structure, flipping from bearish to bullish flow. The bounce from discount levels and move toward premium pricing fits the normal sequence that happens after liquidity gets swept. With buy-side liquidity sitting above previous swing highs, the chart hints these levels could be the next target as long as momentum stays strong. EUR/USD keeps trading within old imbalance zones, and filling these areas backs up the bullish outlook.
⬤ This matters because EUR/USD is showing matching structural movement across different timeframes. When liquidity sweeps, structure shifts, and imbalance zones all line up together, price usually moves more smoothly through its cycle. Getting these patterns helps explain what's driving the pair and shows how EUR/USD might act as it reaches the remaining liquidity areas ahead.
 Saad Ullah


