 Saad Ullah
⬤ XRP is trading around $2.05–$2.15 after losing momentum above recent highs, bringing the price back to a critical spot on the weekly chart. The digital asset is now testing a long-term technical intersection that's been shaping price action since 2021, and so far, the market is respecting the symmetry that's played out across previous cycles.
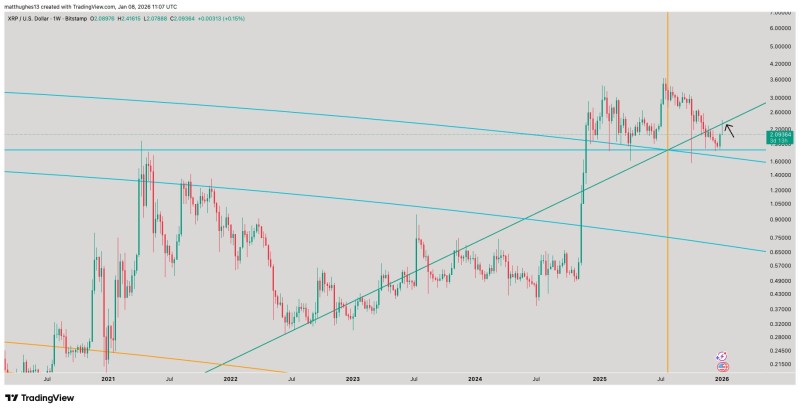
⬤ The chart shows XRP sitting right at the meeting point of two major lines: a rising green support trendline and a descending blue resistance line. After breaking out hard in late 2024 and pushing toward the $3.00–$3.50 range, XRP entered a correction phase. Now it's back at this structural zone where old resistance appears to be flipping into support—a classic technical pattern that's shown up repeatedly in XRP's history.
⬤ Despite the recent pullback, XRP is still trading well above the multi-year base it built during 2022 and early 2023. That suggests the bigger uptrend hasn't broken down yet. What's happening now looks more like a pause than a collapse—weekly candles are consolidating rather than selling off aggressively. How the price behaves at this trendline intersection matters because similar symmetry points have marked turning zones before.
⬤ This setup has broader implications. Long-term symmetry levels often decide whether trends continue or shift into deeper corrections. If XRP holds this trendline, it validates the historical structure and supports the case for stabilization. If it breaks below, the symmetry fails, and further downside becomes likely. The next few weeks should reveal which path XRP takes from here.
 Saad Ullah


