 Saad Ullah
⬤ XRP is catching trader attention as new technical patterns appear on its BTC and ETH pairs. Charts for XRP/BTC and XRP/ETH show hidden bullish divergence forming near long-term support levels, with a potential RSI bullish cross developing above the moving average. The patterns include marked zones showing where price has previously responded to similar setups over recent years.
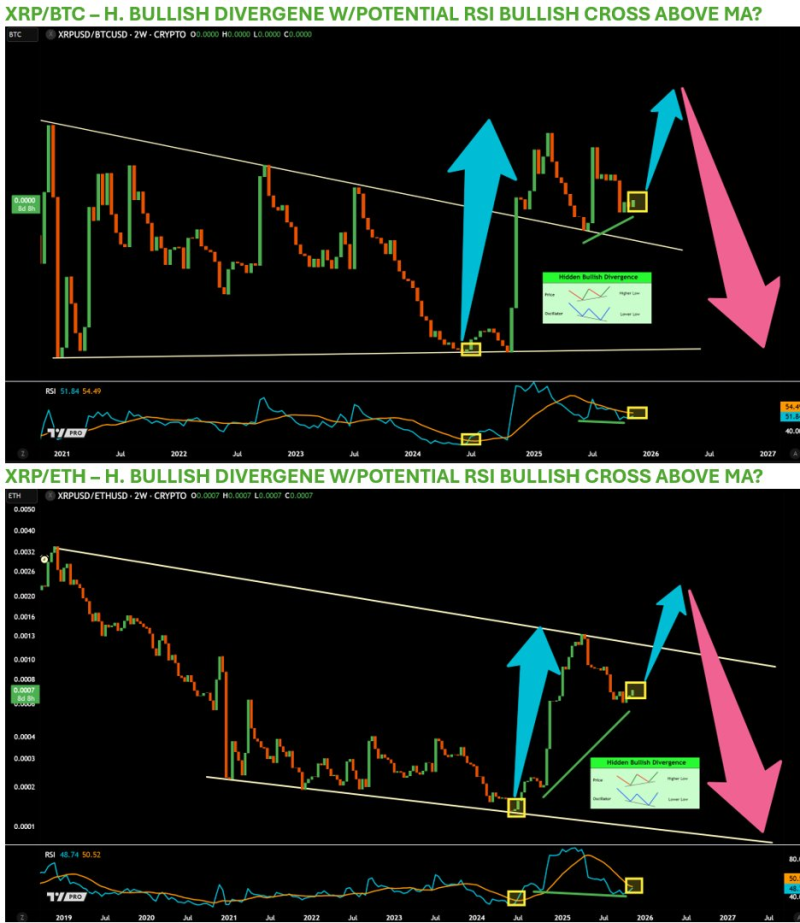
⬤ The XRP/BTC pair is pressing against the lower edge of a multi-year descending channel, with divergence developing at recent lows and a possible RSI crossover taking shape. Earlier rebounds followed similar divergence patterns, though the chart also shows potential reversal risk after any near-term strength. The XRP/ETH chart displays a comparable long-term downtrend channel with hidden bullish divergence near lower support, where RSI is positioned for a potential bullish cross. These technical features suggest XRP could outperform BTC and ETH over the next 2 months.
⬤ The analysis includes a cautious outlook, mentioning expectations of a short-term rise potentially followed by a significant pullback. The charts support the near-term bullish view through highlighted divergence and RSI structures, while also depicting possible downside paths after potential rallies.
⬤ This setup draws attention because divergence signals combined with RSI crossovers often matter during periods of shifting performance among major digital assets. With XRP testing multi-year support zones on both pairs, any near-term strength could influence broader market sentiment around rotation trends and the sustainability of technical rallies in crypto.
 Saad Ullah


