 Eseandre Mordi
⬤ XRP derivatives data is catching traders' eyes as a major liquidity zone takes shape near $3. Binance's long-term XRP USDT perpetual heatmap reveals a thick cluster of liquidity sitting above where XRP currently trades. The data shows this zone has been building for months, but price hasn't reached it yet.
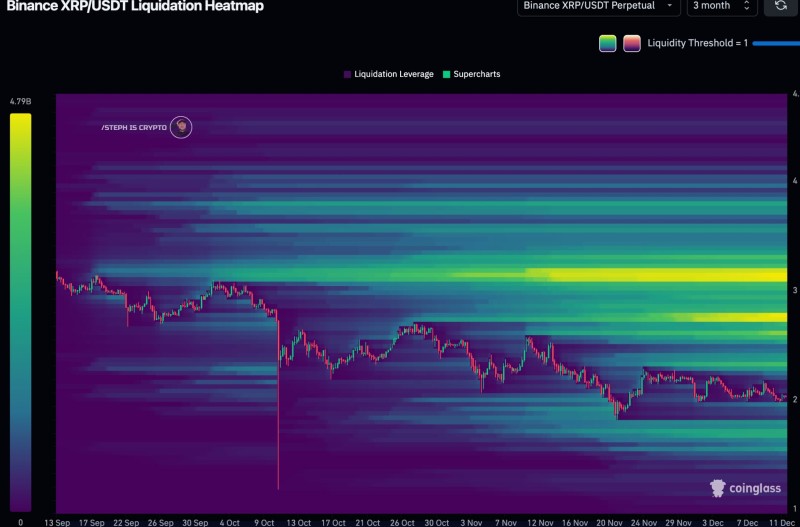
⬤ The liquidation heatmap shows where leveraged positions are stacked at different price points. Bright bands mark zones where liquidations could trigger if price moves there. The strongest concentration sits clearly around $3, while XRP hovers in the lower $2 range. This means a ton of leveraged positions are parked above current market levels.
⬤ Price action has been pretty quiet lately, with XRP trading sideways after earlier drops. The heatmap shows lighter liquidity below current prices, but it keeps building above. This setup shows how derivatives positioning creates zones of interest—though it doesn't guarantee price will move there anytime soon. The chart reflects where traders are positioned, not necessarily where price is headed.
⬤ Big untested liquidity zones like this often become key reference points for the market. They can spark volatility and heavy trading activity when price finally approaches them. While nobody knows exactly when or if XRP will test the $3 zone, it's definitely a level worth watching. How price behaves around this liquidity concentration could offer clues about what comes next as market conditions shift.
 Eseandre Mordi


