 Eseandre Mordi

⬤ XRP dropped during the latest session, extending a pullback that fits within an ongoing correction. The current decline is being tracked as wave (B) inside a larger circular wave B structure. Price has stabilized within a well-defined Fibonacci cluster on the 30-minute chart, hinting that this zone might spark a temporary upward move.
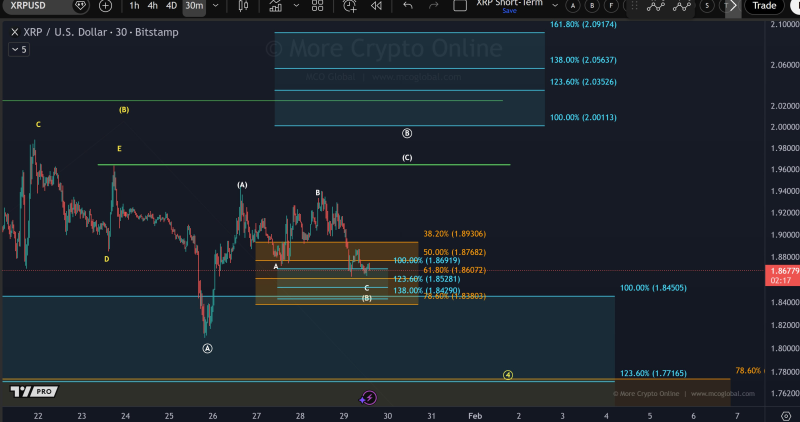
⬤ From a technical standpoint, XRP has pulled back into the $1.87 to $1.84 range, where multiple Fibonacci retracement and extension levels converge. This area lines up with the 61.8% to 78.6% retracement zone—levels commonly watched for corrective bounces. If buying pressure shows up here, wave (c) of circular wave B could start to form.
This zone could trigger a temporary upward reaction as the corrective structure continues to unfold.
⬤ Still, the bigger picture remains corrective. The chart shows the higher-degree correction is still playing out, meaning any bounce would likely be temporary rather than the start of a real rally. If XRP can't hold current levels, the next downside targets sit around $1.78 to $1.77, where deeper Fibonacci extensions and previous demand zones line up.
⬤ This setup matters for the broader market because it captures the tension between short-term recovery potential and ongoing corrective pressure in XRP. A bounce from here might offer temporary stability, but the overall structure still calls for caution. How XRP handles these levels could shape near-term sentiment and volatility across digital assets as the correction unfolds.
 Eseandre Mordi


