 Usman Salis
In crypto trading, patience often separates quick profits from life-changing wealth. XRP (Ripple) quarterly chart shows a parabolic pattern building since 2014 that could lead to massive gains for those willing to wait through the volatility.
XRP's Long-Term Structure Looks Pretty Bullish
The XRP/USD 3-month chart shows a clear parabolic curve forming since 2014. Currently sitting around $2.79, it's pushing toward the $3.40 resistance level from the 2018 peak. According to trader JackTheRippler, most investors will likely exit too early and miss potential triple-digit moves.
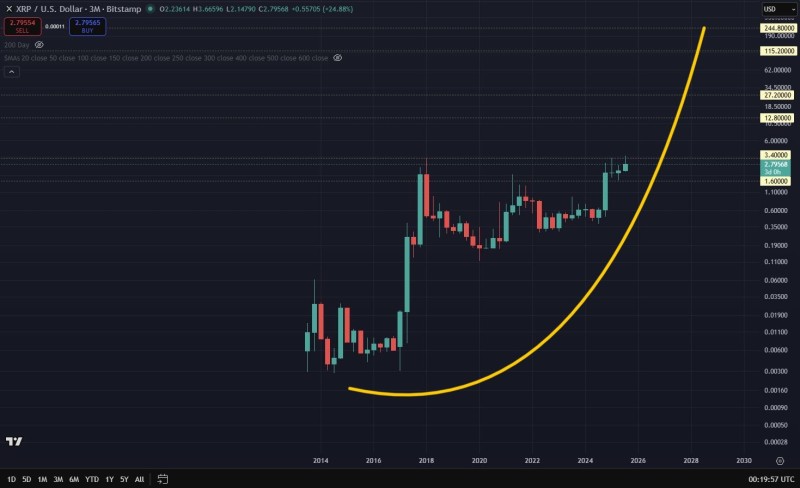
The chart reveals strong technical foundations. A parabolic support curve has held for nearly ten years, while the $3.40 resistance remains the key test. Breaking through could signal a new growth phase, with projections targeting $12.80, $27.20, $62.00, $115, and even $244 along the parabolic curve.
Why This Matters Now
Ripple continues expanding its cross-border payment partnerships with major financial institutions, creating genuine adoption momentum beyond speculation. The favorable progress in the SEC legal battle has cleared away significant regulatory uncertainty that previously weighed on the token. Additionally, we're entering that phase of the crypto cycle where altcoins typically begin their parabolic runs after Bitcoin finds stability, and institutional interest in digital assets for payments is growing stronger than ever.
 Usman Salis


