 Usman Salis
⬤ XRP just broke below its 100-week exponential moving average, and that's raising red flags for anyone who remembers what happened last time. Back in April 2022, the same breakdown kicked off a brutal selloff. Now in January 2026, XRP's trading below that same level again, and the setup looks eerily familiar to traders watching long-term charts.
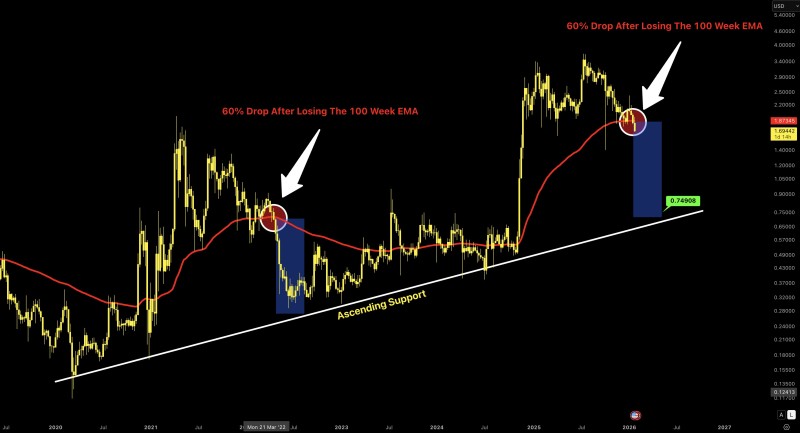
⬤ Here's the scary part: when XRP lost this support in 2022, it dropped about 60% before finally catching itself on an ascending trendline. If history decides to rhyme this time around, we're looking at a potential 69% decline from current levels—which would put XRP around $0.75. That price zone lines up perfectly with the long-term rising support visible on the charts.
⬤ The pattern leading into both breakdowns shows some striking similarities. In each case, XRP rallied hard before running out of steam right around that 100-week moving average, then dropped sharply. The chart's projected downside target shows just how steep this correction could get if the pattern plays out. It's not a done deal yet, but it's definitely a risk worth watching.
⬤ This matters because XRP tends to move aggressively when these major trend indicators flip. Losing the 100-week EMA doesn't just signal technical weakness—it can shift overall market sentiment and create a self-fulfilling downside spiral if traders start expecting a repeat of 2022. Unless XRP can quickly reclaim and hold above this level, the downside risk is real and mounting.
 Usman Salis


