Usman Salis
Stellar (XLM) is back on traders' radars after rallying near $0.60. The token has since pulled back but is now stabilizing above $0.39, potentially setting up for another breakout as the market eyes higher targets.
XLM Chart Analysis: Strong Technical Foundation
The weekly XLM/USD chart shows how Stellar surged in late 2024 before correcting. Despite the pullback, the bullish structure remains intact, according to trader Chad Pumpiano's analysis.
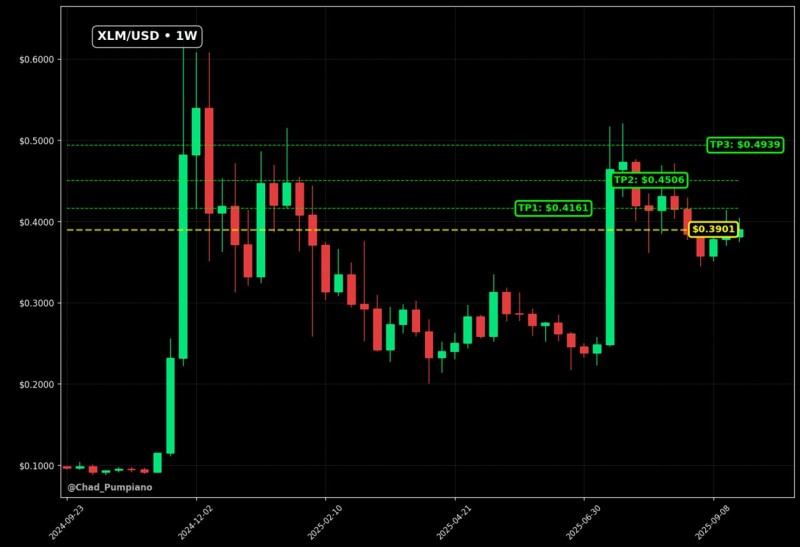
XLM is holding near $0.3901 support, a critical level for maintaining the uptrend. Technical analysis reveals three upside targets:
- TP1: $0.4161 - The first resistance level that needs to be cleared
- TP2: $0.4506 - A stronger resistance zone that could provide temporary pause
- TP3: $0.4939 - The highest near-term target that would signal major bullish continuation
The consolidation pattern suggests buyers are absorbing selling pressure, helping maintain upward momentum.
Why XLM Attracts Bullish Interest
Stellar's role in cross-border payments continues expanding through partnerships with financial institutions. The broader altcoin market recovery has also helped XLM regain traction after months of volatility.
Technically, Stellar offers clear support and resistance levels, making it easier for traders to manage risk and identify profit targets.
XLM Price Targets and Key Scenarios
If Stellar holds support around $0.39, the path toward $0.4161 looks achievable, with continued momentum potentially driving price to $0.4506 and $0.4939.
A breakout above $0.4939 would bring the $0.50 psychological level back into focus, potentially triggering broader market interest and a more substantial rally.
However, failure to hold $0.39 support could invite selling pressure, pushing XLM toward $0.35 or lower, which would delay any meaningful upside progress.
 Usman Salis